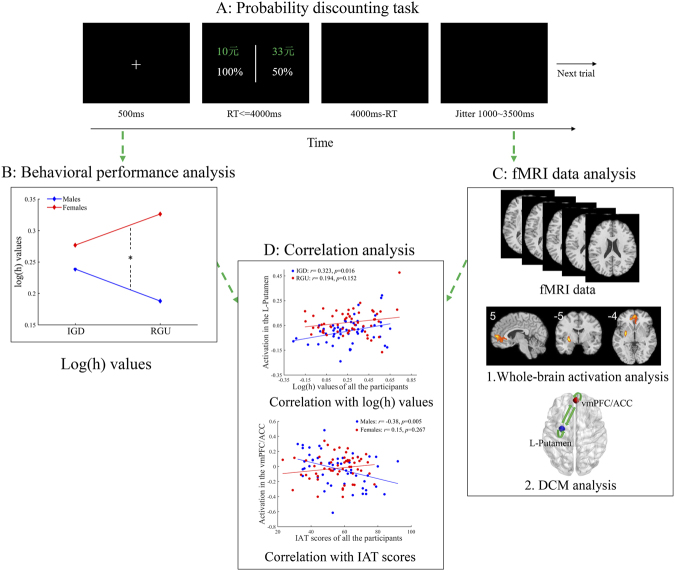
Fig. 1.
The probability discounting task and data analysis
A: The timeline of one trial in the probability discounting task. “元” represents Chinese currency. 1元 is equal to approximately $0.16. B: Behavioral performance analysis depicts the difference in log(h) values (i.e., probability discounting rates) among sexes (males and females) and groups (IGD and RGU). C: fMRI data analysis depicts the difference in whole-brain activation and effective functional connectivity between sexes (males and females) and groups (IGD and RGU). Specifically, whole-brain activation analysis depicts whole-brain activation associated with risk taking. DCM analysis depicts the modulatory effect of risky choices on the connections between and within ROIs. D: Correlation analysis depicts the correlation between brain activation and log(h) values and IAT scores. Abbreviations: RT = reaction time; IGD = internet gaming disorder; RGU = recreational game user; IAT = Internet Addiction Test; DCM = dynamic causal modeling; L = left; vmPFC = ventromedial prefrontal cortex; ACC = anterior cingulate cortex.

