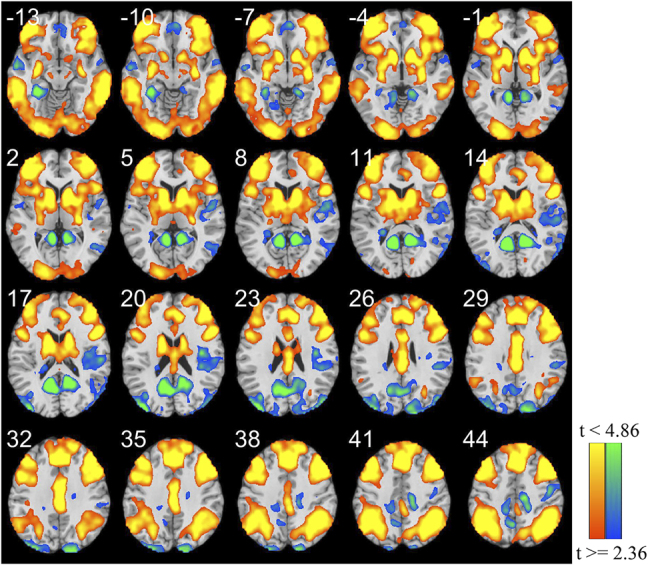
Fig. 3.

The results of whole-brain activation analysis during the contrast of risky choices-safe choices across all the participants
Clusters in red indicate the regions activated positively by the contrast of risky choices-safe choices. Clusters in blue indicate the regions activated negatively by this contrast. Statistical images were corrected using FWE with uncorrected P < 0.02 and cluster P < 0.05.
