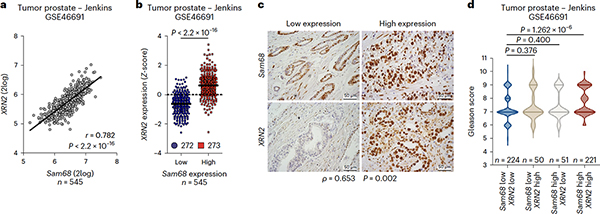
Fig. 2|. XRN2 and Sam68 expression are positively correlated in PC.
a, Pearson’s correlation analyses of XRN2 and MYC expression in the PC Jenkins dataset (GSE46691). Pearson’s correlation coefficient (r; two-sided) and P value are reported (95% confidence interval), b, Dot plot showing the distribution of XRN2 expression in patients with PC (Jenkins dataset, GSE46691), classified into Sam68low (blue circles) and Sam68high (red squares) expression groups according to Z-score normalization. The median is shown as a solid horizontal line, c, Representative images of immunohistochemistry analyses of patients with PC (n = 20) with low and high expression of XRN2 and Sam68. Spearman’s correlation is reported (ρ = 0.653; P = 0.002). d, Violin plot showing the correlation between Sam68 and XRN2 expression with Gleason score, in patients with PC (Jenkins dataset, GSE46691). In b and d, statistical significance was calculated by the Mann-Whitney test (two-sided), and P values are reported (95% confidence interval).

