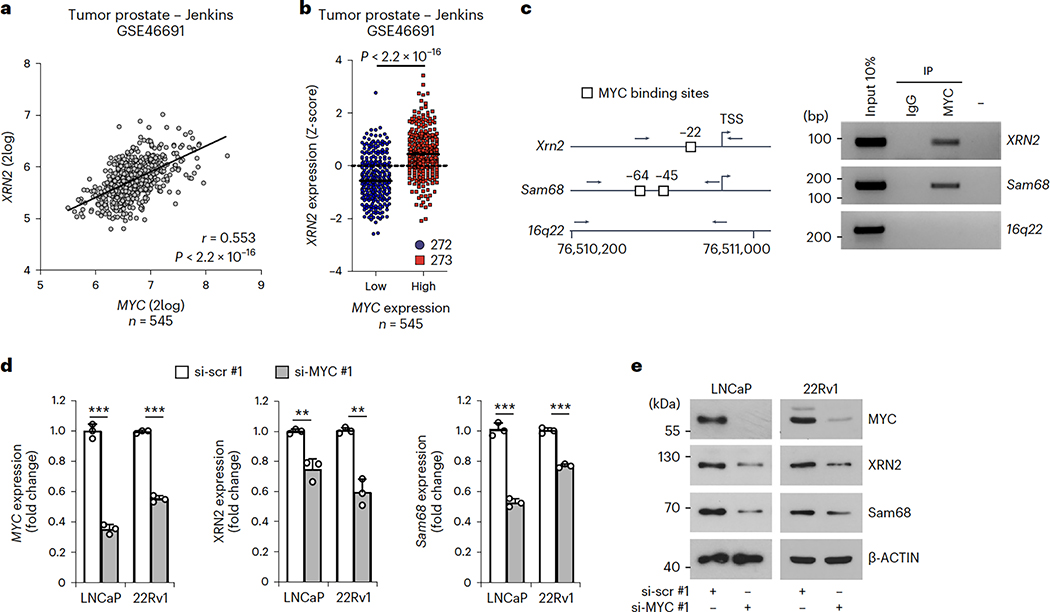
Fig. 3|. MYC positively controlsXRN2expression in PC.
a, Pearson’s correlation analysis of XRN2 and MYC expression in the jenkins dataset (GSE46691). Pearson’s correlation coefficient (r; two-sided) and P values are reported (95% confidence interval), b, Distribution of XRN2 expression in patients with PC classified as MYCflow (blue circles) and MYChigh (red squares) groups according to Z-score normalization of expression data retrieved from the jenkins dataset (GSE46691). Statistical significance was calculated by Mann-Whitney test (two-sided), and the P value is reported, c, Representative semiquantitative (sq) PCR analysis of ChIP experiments (n = 3) performed in LNCaP cells using MYC antibody and IgG, or no antibody (−), as negative controls. MYC binding was evaluated on the XRN2 promoter. Binding to the sam68 promoter and 16q22 intergenic region were used as positive and negative control, respectively. A schematic representation of the indicated promoters and 16q22 intergenic region is also shown. MYC binding sites (boxes), and positions of primers used for PCR analyses (arrows) are reported. d,e, qPCR (d) and western-blot (e) analyses of MYC, XRN2 and Sam68 expression in LNCaP and 22Rv1 cells lines transfected with control (si-scr#l) and MYC (si-MYC#1) siRNAs (n = 3). Expression was reported as fold change (ΔΔCq) with respect to control. Data represent mean + s.d. of three biological replicates, and statistical significance was calculated by unpaired Student’s t-test (two-sided) (MYC/LNCaP P = 3.8 × 10⁻⁵, MYC/22Rv1 P = 5.1 × 10⁻⁶; XRN2/LNCaP P = 3.7 × 10⁻³, XRN2/22Rv1 P = 1.4 × 10⁻³; Sam68/LNCaP P = 8.4 × 10⁻⁵, Sam68/22Rv1P = 7.7 × 10⁻⁵). In d, statistical value is reported as **P < 0.01, ***P < 0.001. In e, β-actin was used as loading control.

