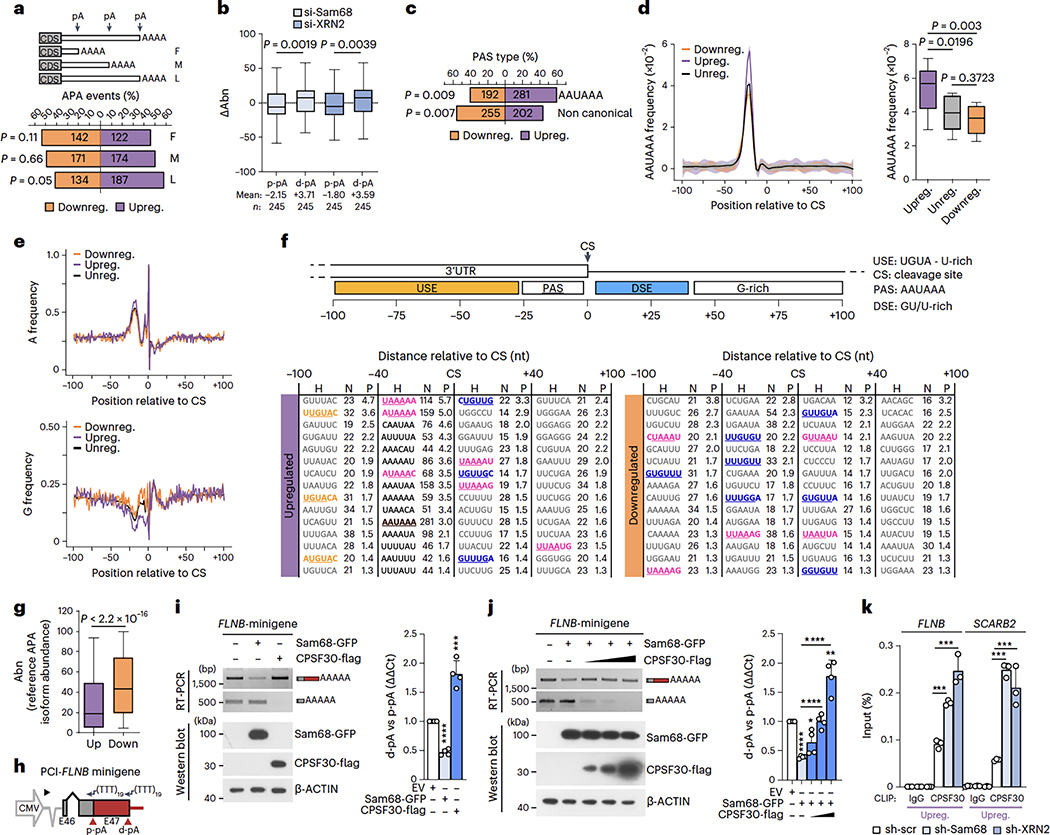
Fig. 6|. Sam68 and XRN2 repress strong, canonical target pAs.
a, Percentage and number of up- (purple) and downregulated (orange) 3’UTR-APA events regulated by Sam68 and XRN2 (pA position is shown as F, proximal-most; M, intermediate; L, distal-most), b, Changes of 3’UTR pA isoform abundance (ΔAbn) at both p-pA and d-pA sites in si-Sam68 and si-XRN2 cells. Mean values and number of pA events (n) are reported, c, Percentage of up- and downregulated canonical and non-canonical PAS sequences in 3’UTR-APA events regulated by Sam68 and XRN2. d, AAUAAA frequency profile in up- (purple), down- (orange) and unregulated (black) 3’UTR pAs evaluated between −100 and +100 nt from the CS (shading represents 95% confidence interval). Statistical significance (unpaired Student’s t-test, two-sided) was calculated between −15 and −25 nt (boxplot). e, A- and G-base frequency distribution in up- (purple), down-grange) and unregulated (black) pAs between −100 and +100 nt from the CS (0). f, Scheme of cis-elements and CS position. Hexamers enriched between −100 and +100 nt from the CS in up- and downregulated pAs with respect to unregulated pAs. Motif (H), number (N) and significance score (P) of hexamers are indicated. Significance score was calculated by –log10(P)xS, where P is based on the Fisher’s exact test and the S value was 1 or −1 for enrichment and depletion, respectively, g, APA isoform abundance (Abn) of si-Sam68/si-XRN2 up- (mean = 28.6) and downregulated (mean = 47.2) isoforms. Values refer to expression in control cells, h, Scheme of the FLNB minigene comprising the genomic region from the second-last exon to 200 nt downstream of the d-pA (source data). i,j, Semiquantitative (micrographs) and quantitative (bar graphs) analyses of pA usage in LNCaP transfected with the FLNB minigene and indicated plasmids (n = 3). Protein expression was evaluated by western blot, k, CLIP assays performed in sh-Sam68 and sh-XRN2 cells using CPSF30 antibody or IgGs (n = 3). Statistical significance was calculated by unpaired Student’s t-test, two-sided (b, g, i-k) and with Fisher’s exact test, two-sided (a, c). (l-k) Bar graphs represent mean + s.d. When not indicated, P values are reported as *P < 0.05, ***P < 0.001, ****P < 0.0001 (exact P values are reported in the source data). In the boxplots (b, d, g), the center line and box indicate the median and the 25th and 75th percentiles, respectively. Whiskers indicate ±1.5x interquartile range.

