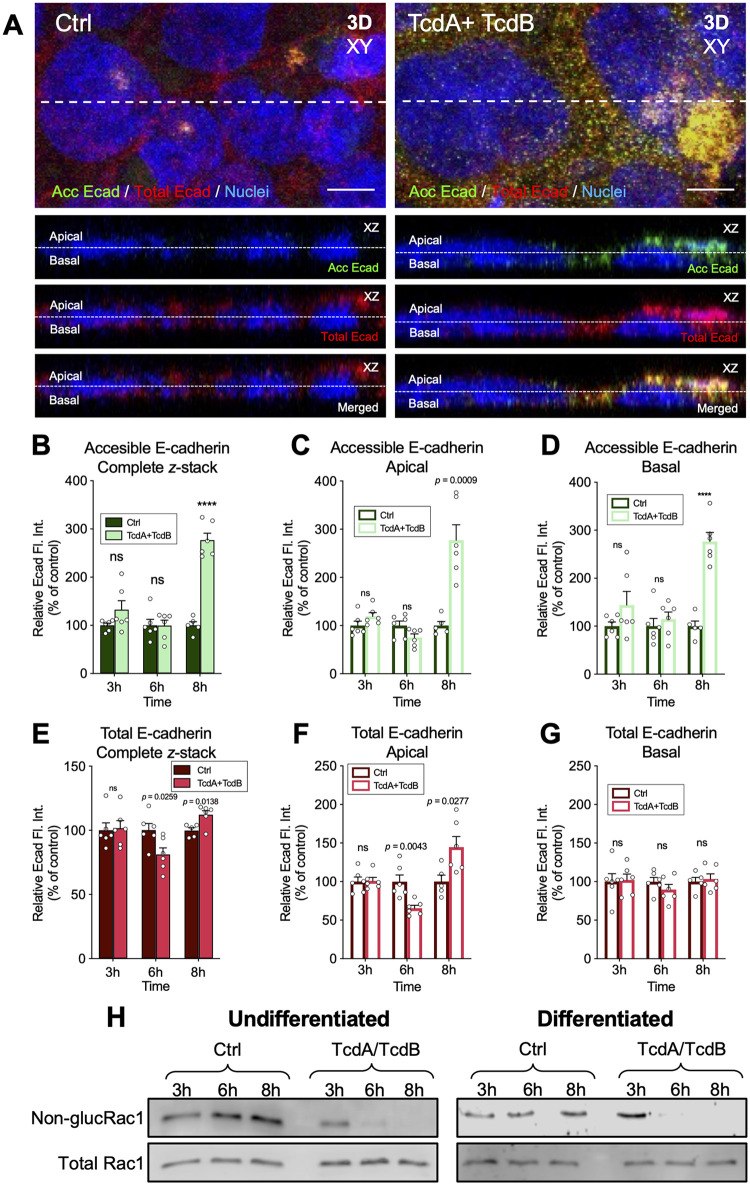
FIG 2.
The accessibility of E-cadherin increases in TcdA- and TcdB-intoxicated IECs. Differentiated TcdA- and TcdB-intoxicated Caco-2 cells for 3, 6, or 8 h in DMEM without serum. As a control, cells were incubated with DMEM without serum. Nonpermeabilized cells were stained for accessible E-cadherin (shown as acc Ecad; green) and permeabilized, and total E-cadherin was stained (shown as total Ecad; red) and nuclei (blue). (A) Representative confocal microscopy images in 3D (xy) projection of control cells (left) and TcdA- and TcdB-intoxicated cells for 8 h (right); below the orthogonal view (xz; accessible E-cadherin, total E-cadherin, and merged) of the dotted line of the xy. Representative confocal images for 3 h and 8 h not shown. (B to D) Relative fluorescence intensity measured as the sum of each z-step of accessible E-cadherin (B) and its abundance in the apical side (C) or in the basal side (D) of the cell. (E to G) Relative fluorescence intensity of total E-cadherin (E) and its abundance in the apical side (F) and the basal side (G) of the cell. Controls were set at 100%. Error bars indicate the mean ± SEM from at least 9 fields (n = 3). (H) Immunoblotting of anti-nonglucosylated Rac1 and total Rac1 of cell lysates of undifferentiated and differentiated Caco-2 cells intoxicated with TcdA and TcdB for 3, 6, or 8 h. For undifferentiated and differentiated Caco-2 cells, nonglucosylated Rac1 was evaluated with corresponding antibodies, then the membrane was stripped, and subsequently tested for total Rac1. Western blotting is representative of 3 independent experiments. Statistical analysis was performed by two-tailed unpaired Student’s t test. ns, P > 0.05; ****, P < 0.0001. Bars, 5 μm. Fl.Int., fluorescence intensity.

