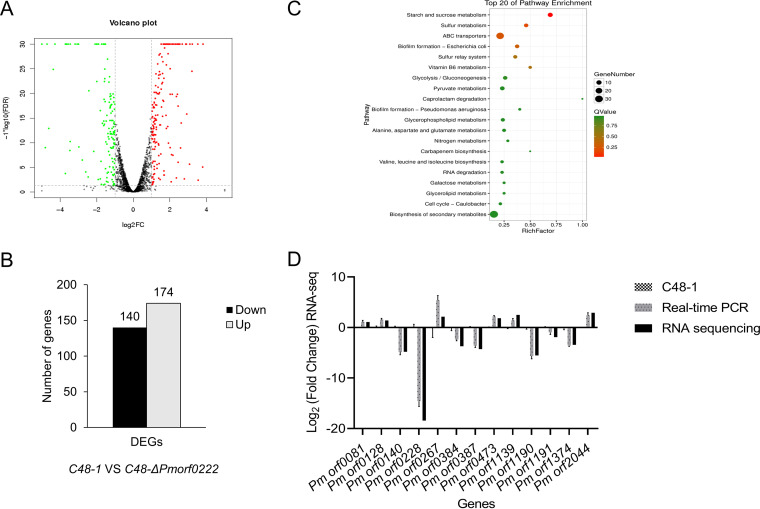
FIG 7.
The expression of the virulence genes by transcriptome analysis. (A) Volcano plot for clustering of differentially expressed genes (DEGs; fold change [FC] of ≥1) of the wild-type strain and mutant strain. FDR, false-discovery rate. (B) The up- or downregulated DEGs (FC of ≥1) in the wild-type strain and mutant strain. (C) The top 20 enriched KEGG pathways for the up- or downregulated DEGs (FC of ≥1) in the wild-type strain and mutant strain. (D) To validate the reliability of the data obtained by transcription in vitro, 13 DEGs obtained after analyzing the RNA sequence were validated using qRT-PCR. The experiments were performed at least three times. RNA-seq, RNA sequencing.

