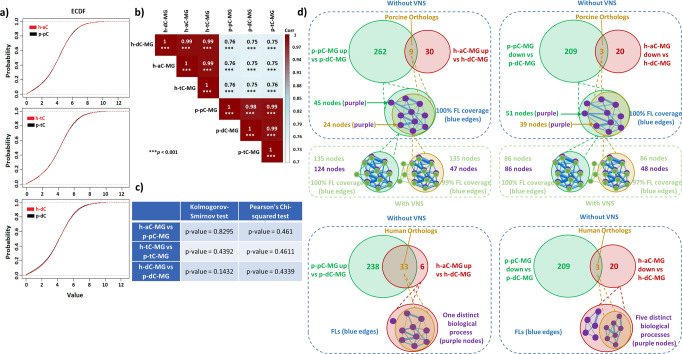
Fig. 2. Transcriptomic similarities of colonic myenteric ganglia between pig and human.
Probability distributions of human-porcine regional datasets selected from the high-quality orthologous gene list between myenteric ganglia (MG) from porcine proximal, transverse and distal colon (p-pC, p-tC, p-dC) and in parallel from human ascending, transverse and descending colon (h-aC, h-tC, h-dC) a, Spearman’s Correlation b, and evaluation of goodness of fit c. Color in b represents a correlation distribution from big (dark red) to small (light blue). Cartoon diagram showing regional differentially expressed gene (DEG) network matching between human and pig d. Gene Ontology Biological Processes terms (pathways) are shown as circles (nodes) that are connected with lines (edges) if the terms share many genes. Nodes are colored in purple (without VNS) and in light green (with VNS), and edges are sized on the basis of the number of genes shared by the connected pathways. FLs functional linkages, VNS vagal nerve stimulation, Up upregulated expression, Down downregulated expression.

