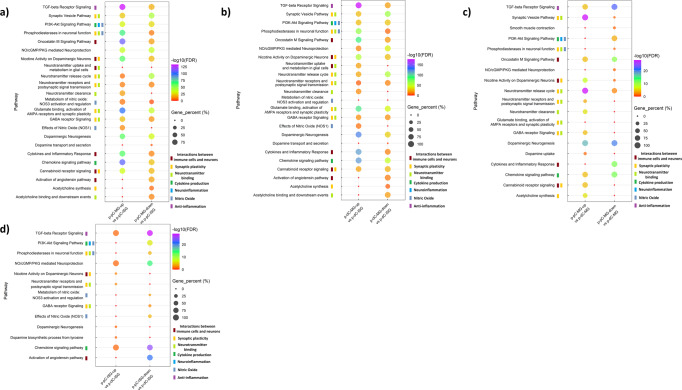
Fig. 3. Preferential enrichment for genes associated with functions of myenteric and inner submucosal ganglia (MG, ISG) in porcine proximal or distal colon (p-pC, p-dC).
Comparison of pathway enrichment between MG and ISG in p-dC or p-dC a, b, and in MG or in ISG between p-pC and p-dC c, d. The bubble plots show the gene percentage and enrichment of WikiPathways. Circle size represents the ratio of the number of pathway-specific differentially expressed genes (DEG) and the number of total DEG in each DEG list (Gene_percent). Color represents a -log10(FDR) distribution from big (orange) to small (purple). The color bars mean the specified WikiPathways classified into designated clusters. Up, upregulated expression. Down, downregulated expression.

