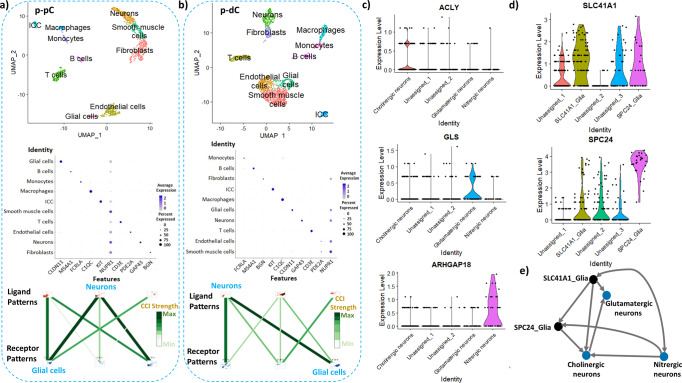
Fig. 4. Visualization of cell types and their interaction strength in the colonic muscularis externa of naive pigs by single-cell RNA sequencing.
The clusters were labeled according to their markers and only neuronal and glial cell markers were verified by in situ hybridization in the pig proximal colon (p-pC) a and pig distal colon (p-dC) b. Uniform Manifold Approximation and Projection (UMAP) visualized 10 distinct cell clusters and the cell-cell interaction (CCI) strength between neurons and glial cells was highlighted only. Color represents a CCI strength distribution from maximum (green) to minimum (white). The distinct cell clusters were derived from 2091 cells of one p-pC individual and from 3918 cells of one p-dC individual. Joint visualization based on four individuals of p-pC and p-dC could be found in Supplementary Figure 3. Violin plots depict the distribution of gene expression levels for 3 neuronal subpopulations c and 2 glial subpopulations d. Interactions (arrows) from ligand- to receptor-expressing neuronal and glial subsets e. Blue, neuronal subset; Black, glial subset. Growth associated protein 43 (GAP43), a marker for annotating pan-neurons; Claudin 11 (CLDN11) for pan-glial cells; ATP citrate lyase (ACLY) for cholinergic neurons; Glutaminase (GLS) for glutamatergic neurons; Rho GTPase activating protein 18 (ARHGAP18) for nitrergic neurons; Solute carrier family 41 member 1 (SLC41A1) and SPC24 component of NDC80 kinetochore complex (SPC24) for two subtypes of glia.

