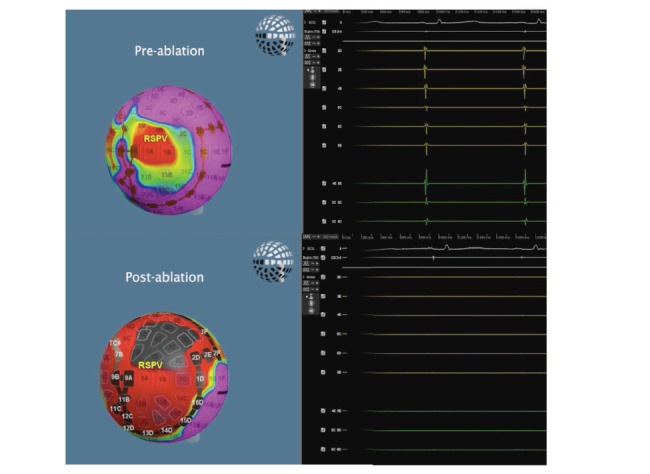
Figure 5: Voltage map and electrograms before and after the isolation of the right superior pulmonary vein. The voltage map automatically shows the amplitude of the intracardiac electrograms over a portion of the cardiac cycle, with purple indicating high voltage, red low or no voltage and grey no contact. We can see how the electrograms disappear after pulsed electrical field ablation.

RSPV = right superior pulmonary vein.
