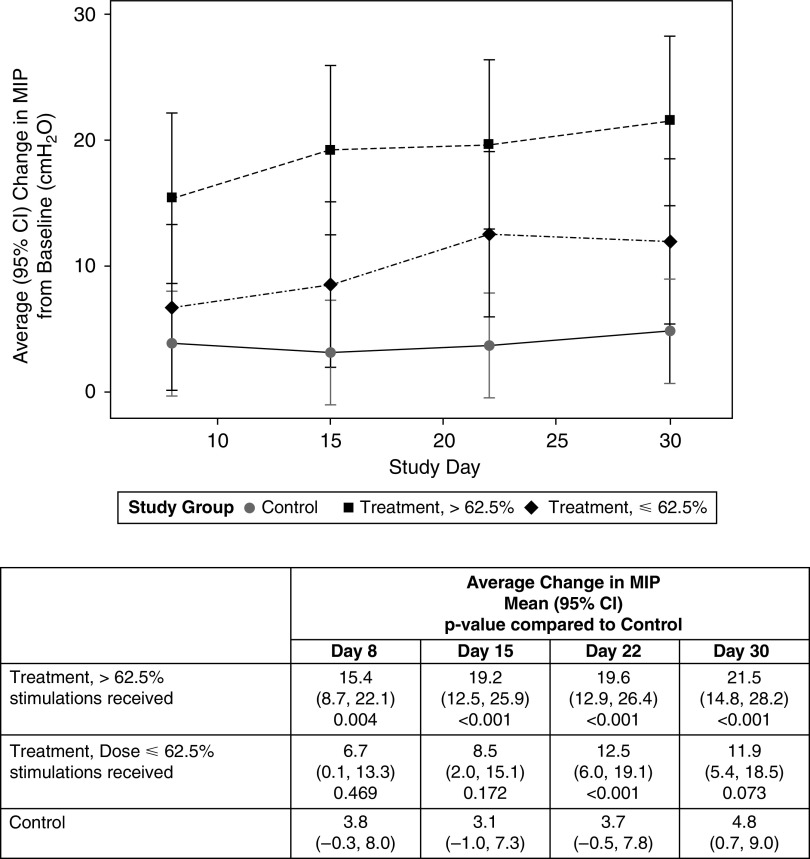
Figure 3.
Dose relationship between stimulation “dose” and maximal inspiratory pressure (MIP). For study group with treatment divided into two groups on the basis of the median proportion of protocol required stimulations received, P < 0.001, study day P = 0.025, and study group × study interaction P = 0.108. CI = confidence interval.

