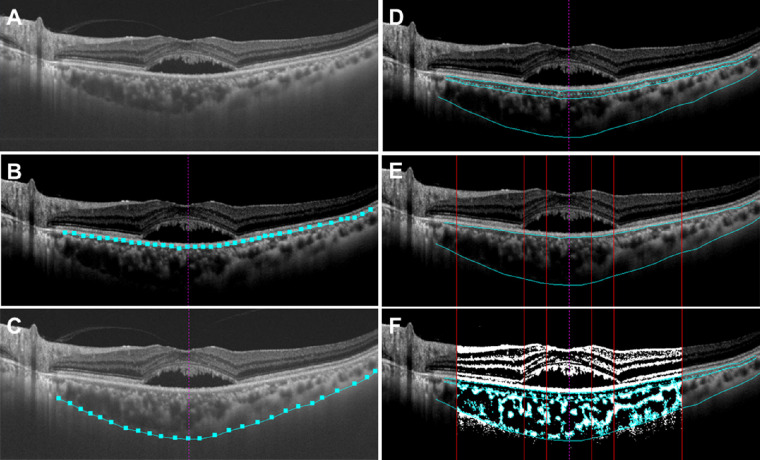
Figure 2.
SS OCT images of the choroid converted to binarization images by semiautomated software “EyeGround.” (A) The horizontal cross-sectional OCT image through the foveal center is converted to a TIFF image. (B) The RPE layer is segmented using the automatic discrimination of the software (light blue square and line). The vertical purple dashed line indicates the foveal center. (C) The chorioscleral border is manually segmented (light blue square and line). (D) The choroid is automatically divided into choriocapillaris, Sattler's layer, and Haller's layer. The light blue dashed line indicates the border between the choriocapillaris and the vascular layer. (E) The area of the choroid is demarcated into 1500 µm, 3000 µm, and 7500 µm ranges centered at the fovea (vertical red lines). (F) The images are binarized by the Niblack method and the L/S ratio is calculated from the luminal and stromal areas.

