
Fig 2.
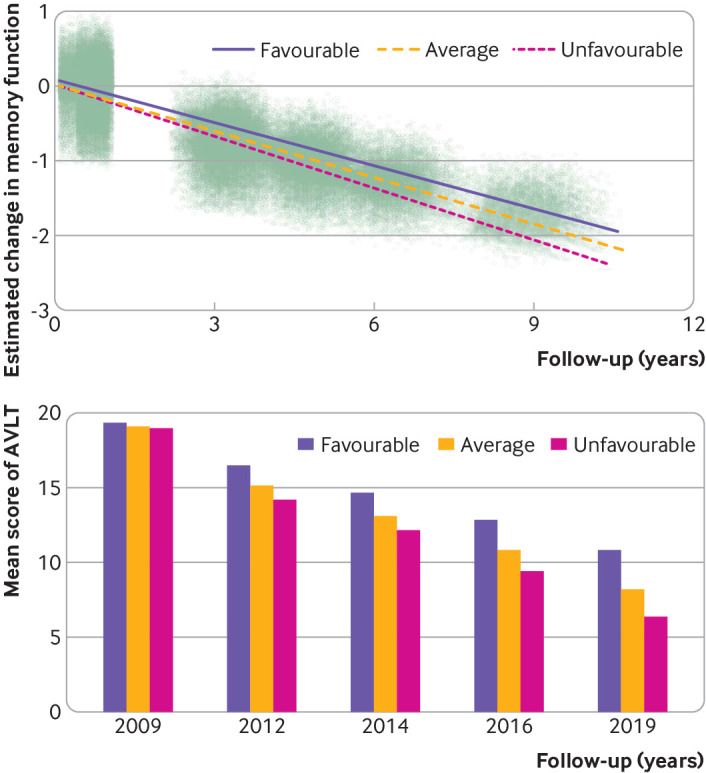
Longitudinal change in memory among favourable, average, and unfavourable groups in the cognitively normal population. (Top panel) Estimated change in memory function over 10 years, by group. Dots represent individuals’ estimated composite z scores for AVLT. (Bottom panel) Mean composite AVLT z scores of all groups. AVLT=Auditory Verbal Learning Test