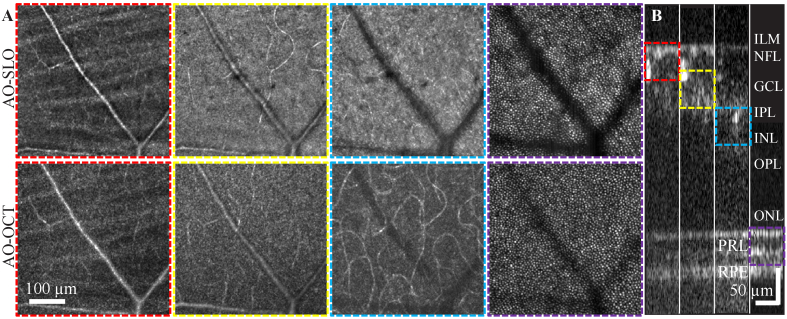
Fig. 3.
Co-registered averaged 1.5° FOV simultaneous AO-SLO (A top) and AO-OCT (A bottom) retinal images from S1 with the system focus set approximately at four depths (ILM-GCL; GCL-IPL; IPL-OPL and PRL) which are determined by the local intensity of the AO-OCT B scans and AO-SLO real-time visualizations. The AO-SLO data were collected with a one Airy disk diameter (ADD) pinhole. The AO-OCT en face images were created by the amplitude projection of a AO-OCT 50 µm slab through the system depth of focus (DOF) [8]. Each image was averaged across 15 datasets and was produced from videos in Visualization 1 (20.3MB, mov) . B shows the average of 15 AO-OCT B-scans along the slow scan direction, the image are stitched from four sub-images that were acquired with system focus at the four primary depths from the same retinal location. The color-coded dash boxes represent the ranges for generating the corresponding AO-OCT en face images in A.

