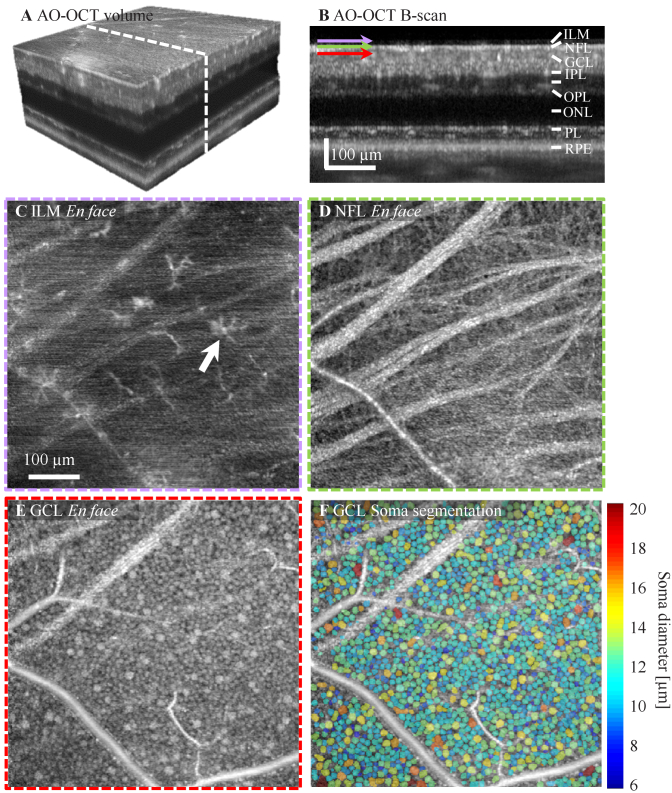
Fig. 4.
Structural images of inner retinal cells collected at 10° temporal to the fovea from subject S1 with an average of 285 AO-OCT volumes. A. Isometric view of registered and averaged AO-OCT volume with white dashed line denoting cross-section of retina shown in B. Images shown in C-E were extracted at depths of the ILM, NFL, and GCL, respectively. C. Retinal macrophages (both cell body and processes) shown at the surface of the ILM. D. Bundles and individual ganglion cell axons disperse across the NFL. E. A mosaic of GCL somas of varying size tile the layer. F. GCL soma 3D segmentation. The false color map shows the segmented GCL somas that are color coded with cell diameter.

