Fig. 5.
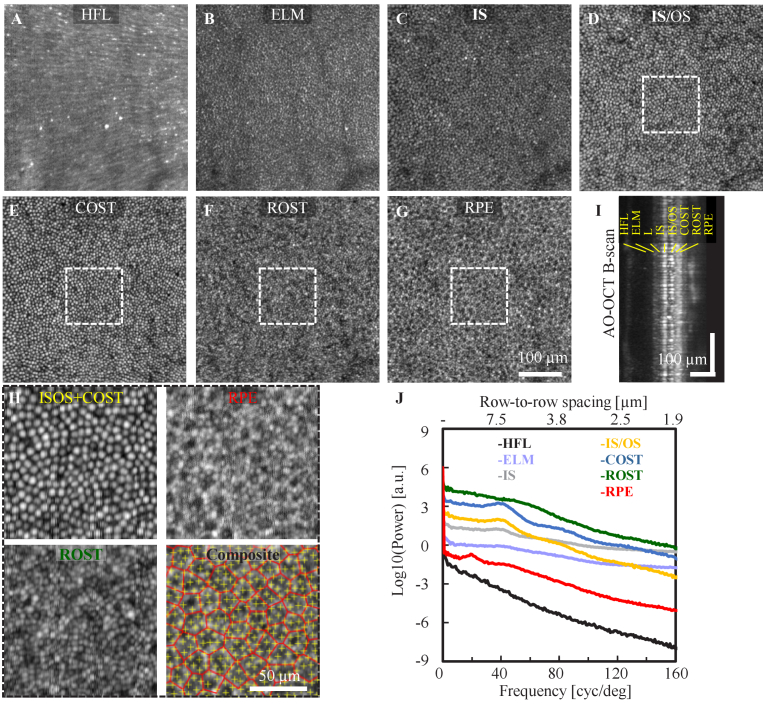
Structural images of outer retinal cells collected at 3° temporal to the fovea from subject S2 with an average of 190 AO-OCT volumes. En face views of outer retinal cells at different depths show different spatial content. A. The HFL shows radial striation pattern of Henle fiber bundles, B. ELM intensity show negative correlation with underlying cone photoreceptors in (C-E), C. Photoreceptor IS, D. Photoreceptor IS/OS junction. E. COST, F. ROST layer exhibits a hyper reflective mosaic with higher spatial content, presumably from individual rods, G. RPE, H. Magnified views at the cone (IS/OS + COST), rod, and RPE layers (white boxes in D-G) along with the composite view that shows the marked cell locations (yellow cross: cone and red Voronoi: RPE). I. An average AO-OCT B-scan of outer retina with labeled axial depths, and J. Power spectral analysis at the corresponding axial depths (see Data File 3 (19.4KB, csv) [60]). For visualization purposes, spectra are normalized to the same DC level and displaced vertically by retinal layers. Images are showed in logarithmic scale.

