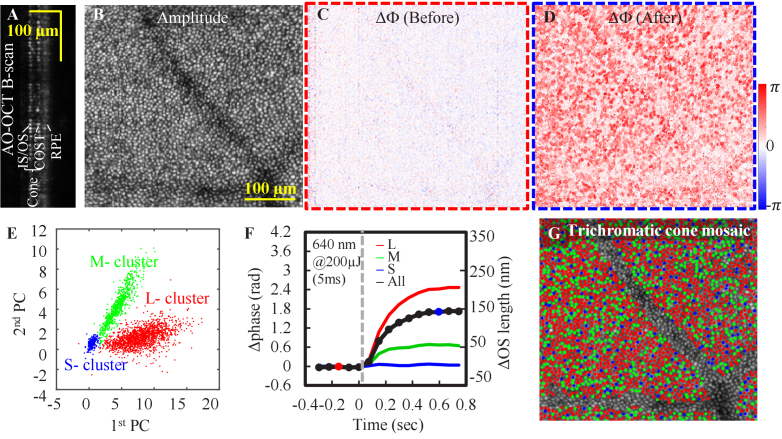
Fig. 8.
Cone structural and functional characterization in subject S1 at 3° nasal retina. A. B-scan and B. en face views show reflectance of individual cones. Cone ΔOPL between IS/OS and COST in response to 640-nm stimulus at time points 3 in C. and 13 in D. E. Plot of first two principal components (PC) used to classify cone types. F. Shows the averaged cone response at all time sequence (see Data File 5 (1.5KB, csv) [65]). Averaged cone response in C. and D. are shown as the red and blue filled circles. The classified averaged response for L-, M-, and S- cones are denoted as red, green and blue curves. G. Map of the trichromatic cone mosaic.

