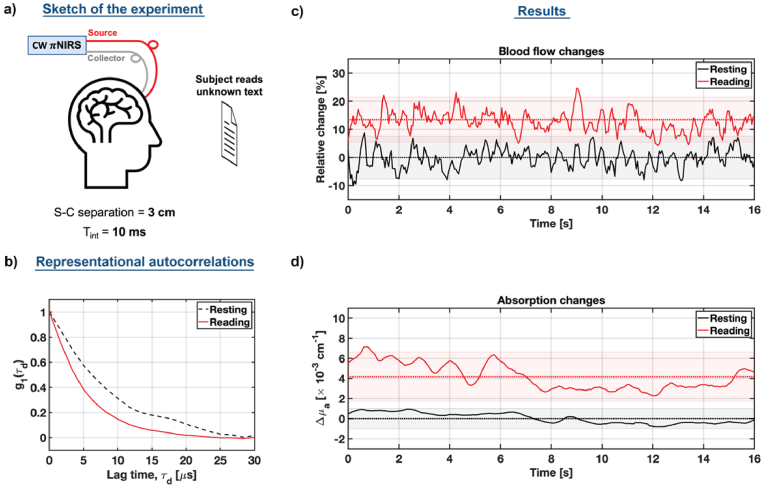
Fig. 10.
NIRS monitors prefrontal cortex activation. (a) Schematic diagram of the experiment. (b) Representative autocorrelations (10 msec integration time) for the resting (baseline) and reading stage (activation). (c) Relative blood flow index and (d) relative absorption changes during the reading stage are compared to the resting stage, demonstrating the increase in blood flow and absorption during the prefrontal activation.

