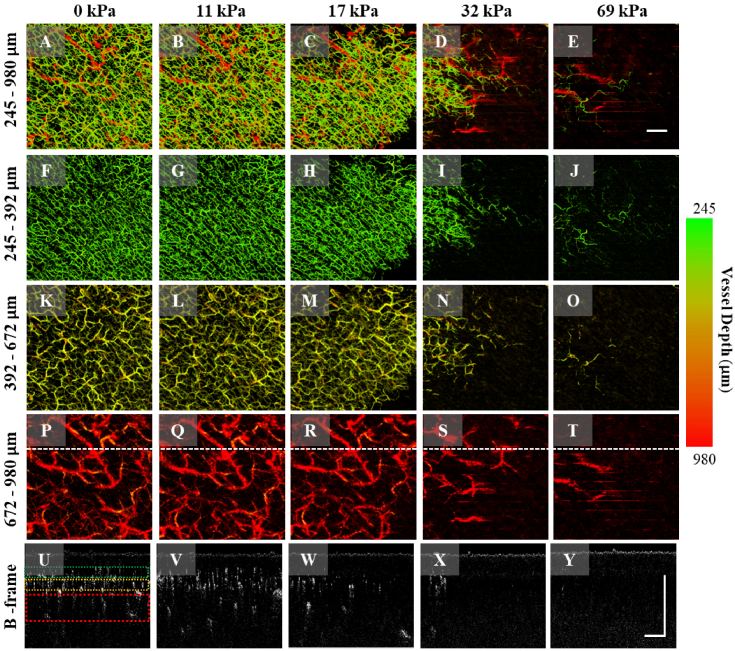
Fig. 3.
The changes in OCTA imaging upon the applied pressures on the skin surface. (A-E) the en face OCTA maps of the whole skin depth from 245-980 µm under the pressure of 0, 11, 17, 32, 69, respectively, as shown. (F-J) the same as in (A-E) but the selected slab depth of 245–392 µm. (K-O) the same as in (A-E) but the selected slab depth of 392–672 µm. (P-T) the same as in (A-E) but the selected slab depth of 672-980µm. (U-Y) representative OCTA B-scans at the position marked as dashed white line in (P-T), where the green square indicates the depth of 245–392 µm below the surface; the yellow square indicates the depth of 392-672 µm below the surface; and the red square indicates the depth of 672-980 µm below the surface. All en face vascular maps were produced by maximum intensity projection. Color bar represents vessel depth. Scale bar represents 1 mm

