
Fig. 4.
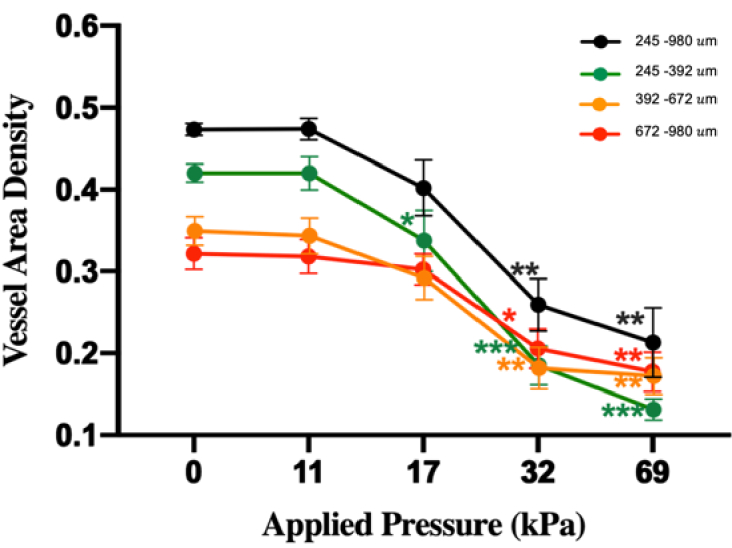
The alteration in vessel area density (VAD) upon the applied pressures. The curves shown are from the whole skin depth (245 - 980 µm), and the slab depths of 245-392 µm, 392-672 µm and 672-980 µm, respectively. Error bar represents standard deviation from four sessions. *, P value < 0.05; **, P value < 0.01; ***, P value < 0.001.