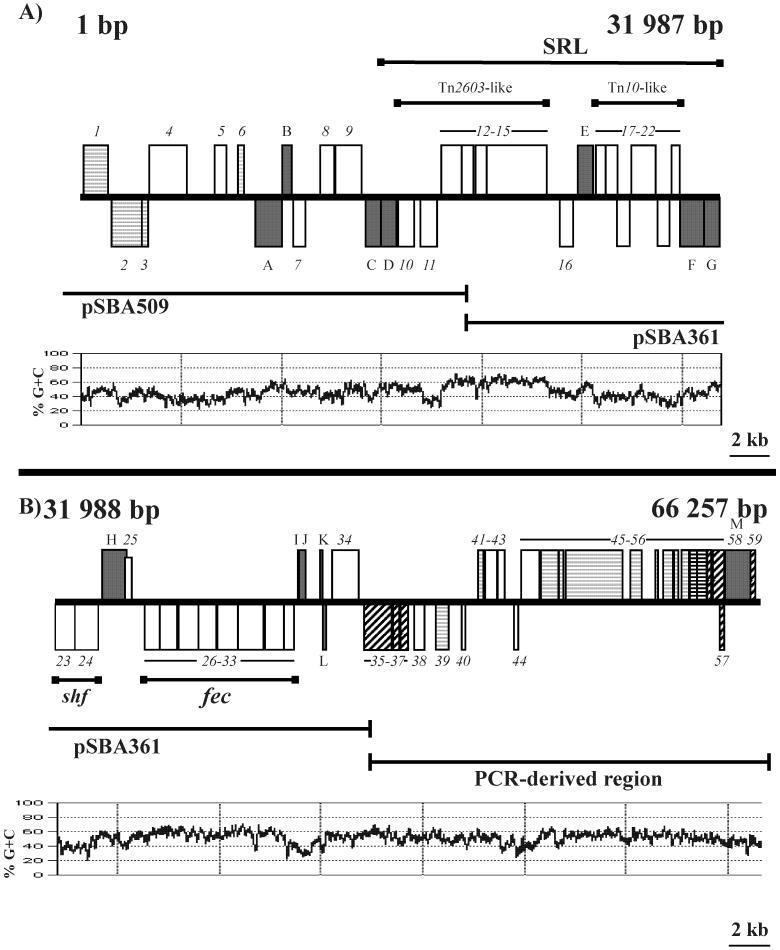
FIG. 3.
Genetic organization of the SRL PAI. A map of the SRL PAI sequence from bp 1 to 31,987 (A) and 31,988 to 66,257 (B) is shown. The ORFs are represented by boxes above the line (forward orientation) or below the line (reverse orientation). The unlabeled open boxes represent ORFs of unknown function. IS elements (grey boxes) have been designated A through M (Table 3). Boxes with light grey horizontal lines represent the CP4 prophage-related ORFs, while boxes with diagonal black lines represent 933L prophage-related ORFs. Boxes with black horizontal lines represent ORFs that have homologs on both the 933L and CP4 prophages. Sequence data were derived from the genomic subclones pSBA509 and pSBA361 and PCR-derived products indicated below each map. The G+C content of the SRL PAI was plotted using a window size of 100 bp.

