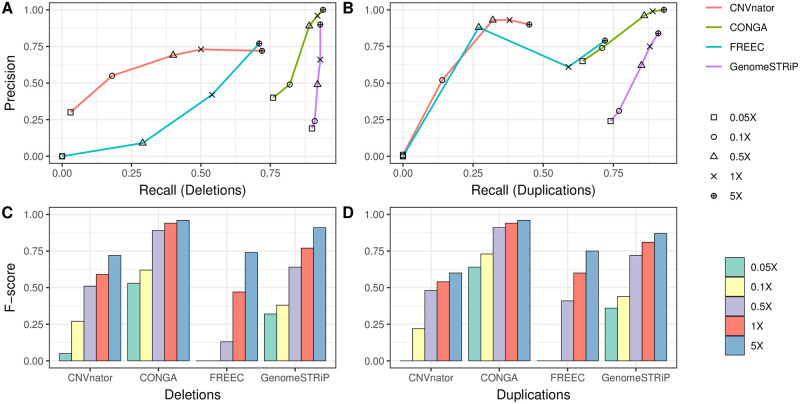
Fig 2. CNV prediction performances of CONGA, GenomeSTRiP, FREEC and CNVnator on simulated genomes.
In (A) and (B), we show recall-precision curves based on depths of coverage values for deletions and duplications, respectively. In (C) and (D), we show the F-scores, calculated as (2 × Precision × Recall)/(Precision + Recall)). The figures represent the average statistics calculated for medium (1 kbps–10 kbps) and large (10 kbps–100 kbps) CNVs. See Table A in S1 Table for detailed information including small (100 bps–1 kbps) CNVs, as well as mrCaNaVaR predictions for large variations. Commands used to run each tool are provided in S1 Text. The results here were generated using the cutoff C-Score <0.5 for CONGA, while no read-pair or mappability filters were applied.

