
Fig. 2. Pcdh19HET♀, but not Pcdh19HEMI♂, mice show impaired mossy-fiber presynaptic development and function.
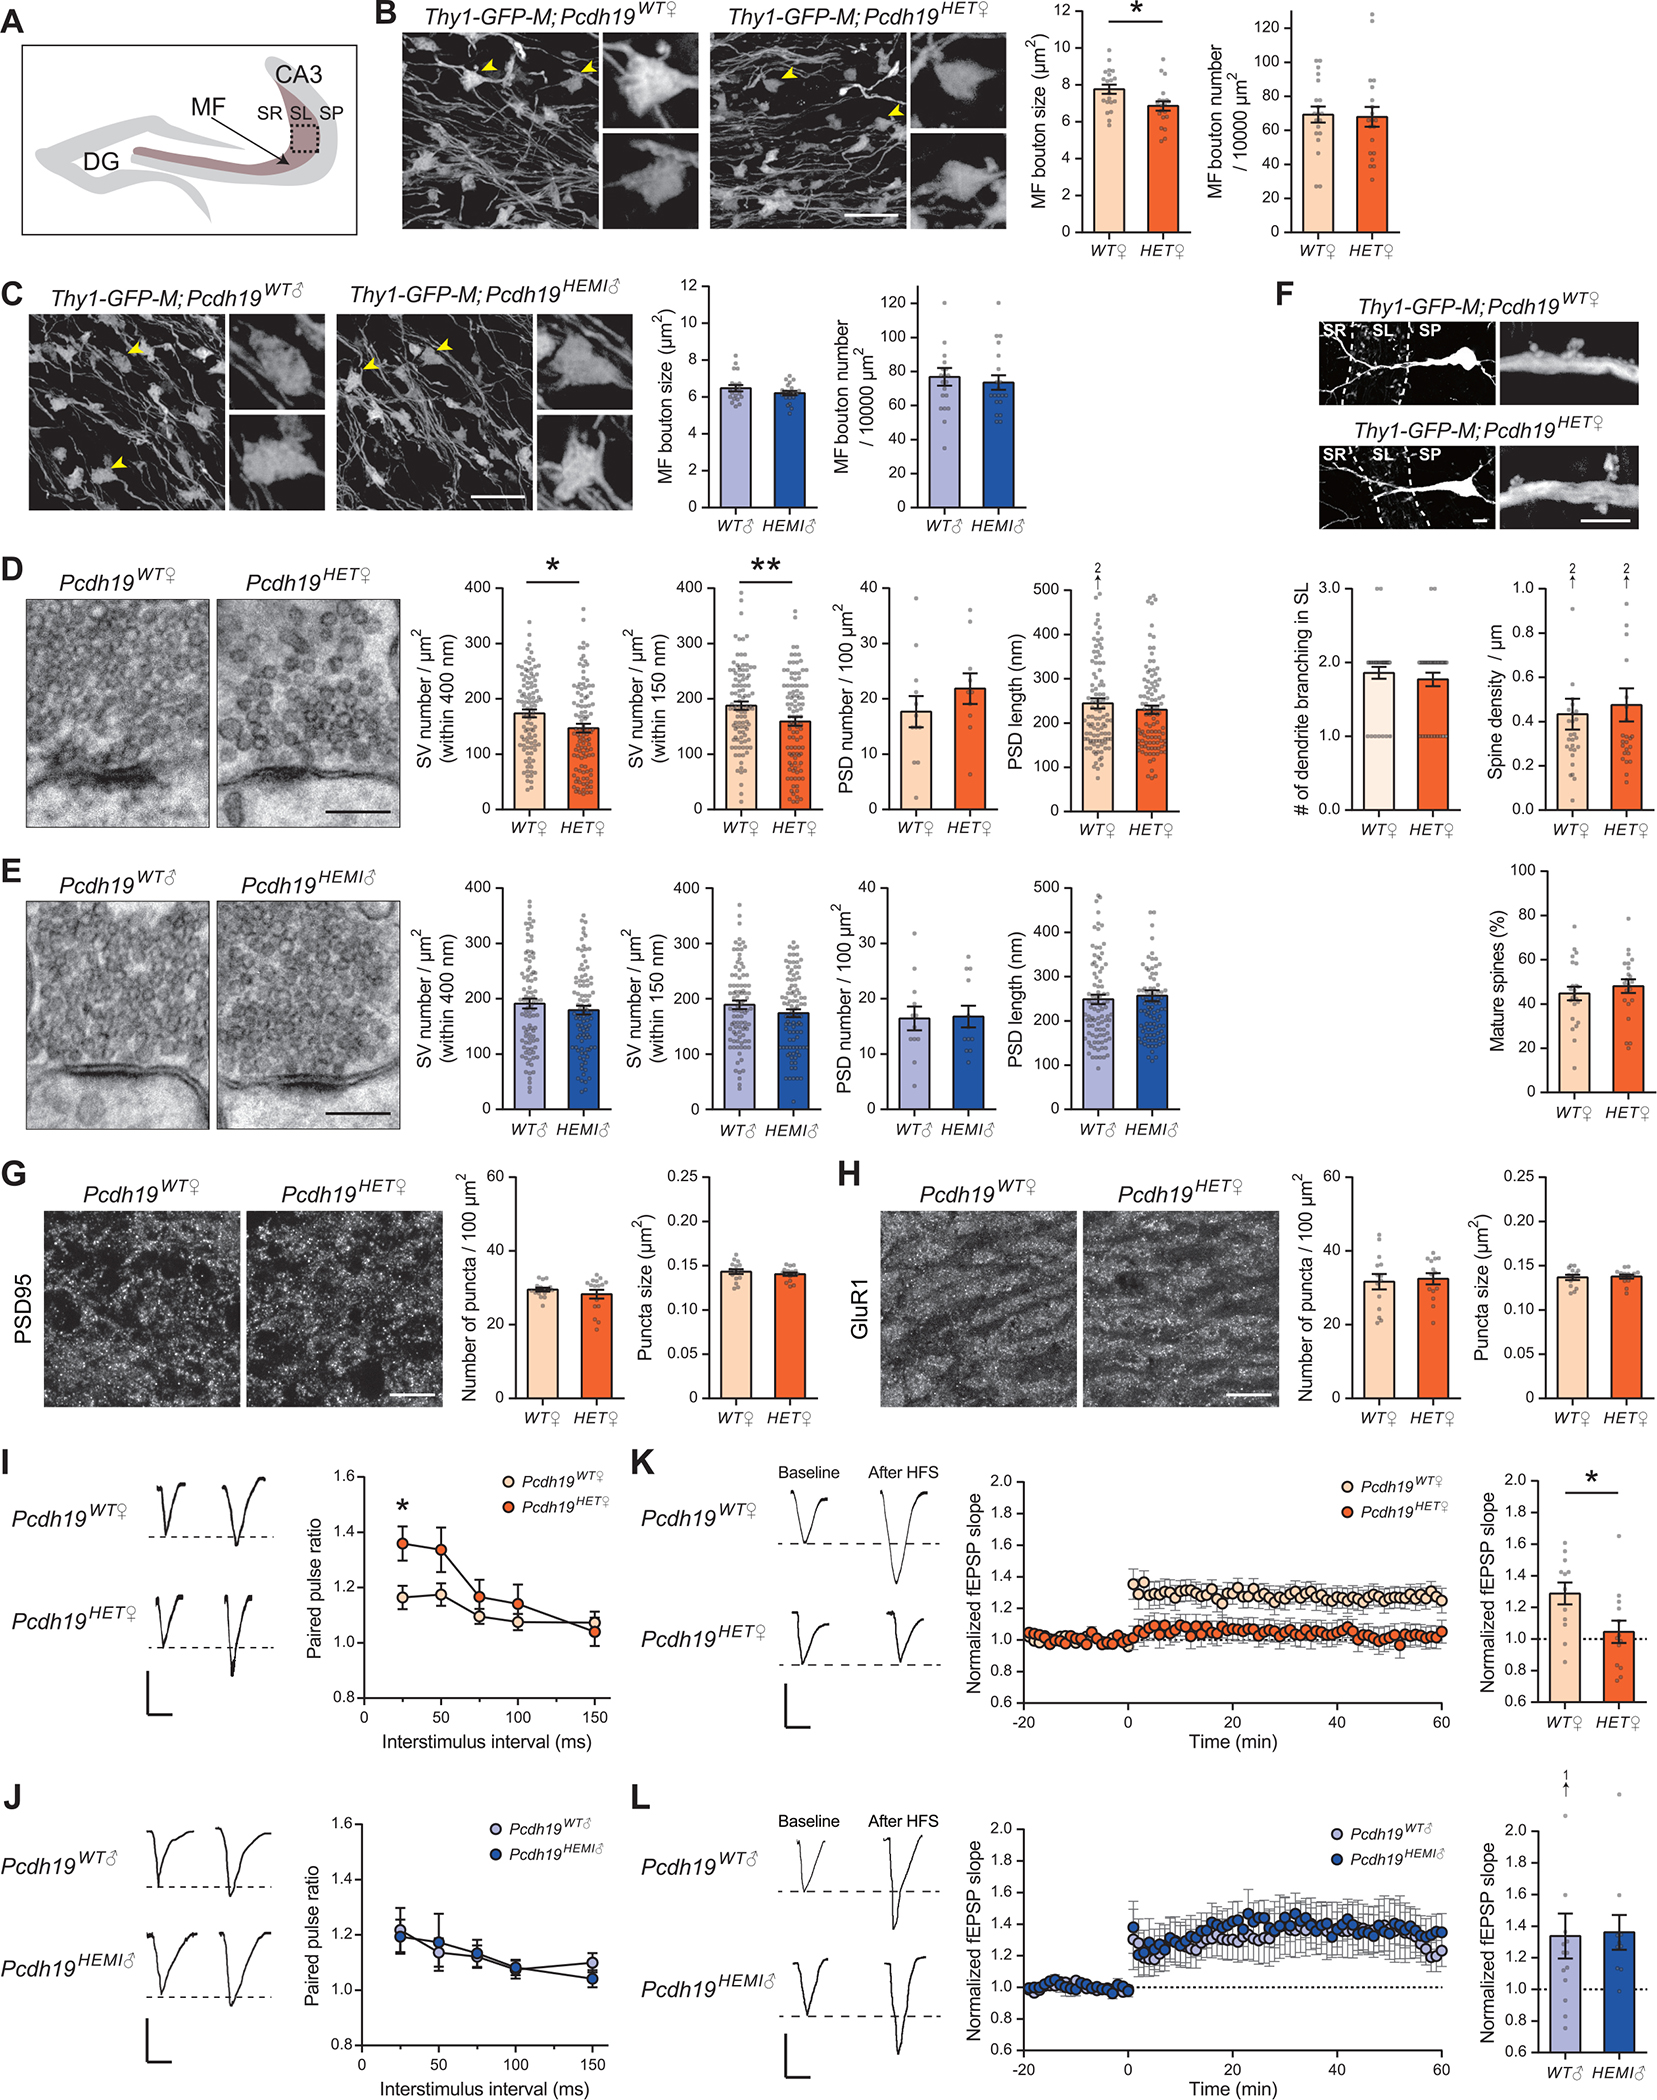
(A) Illustration indicating the pictured area in B, C, G, and H. Images were taken from the CA3 SL layer (MF layer; boxed).
(B and C) Analysis of MF terminals in 4-week-old female (Pcdh19WT♀ and Pcdh19HET♀; B) and male (Pcdh19WT♂ and Pcdh19HEMI♂; C) mice, visualized by mating them with the Thy1-GFP-M line. MF terminals indicated by the arrowheads are magnified. MF bouton size is decreased in Pcdh19HET♀, but not in Pcdh19HEMI♂, mice compared to controls. MF bouton density is similar between control and mutant. n = 20 fields from 4 mice per genotype.
(D and E) Electron microscopic analysis of MF synapses in 4-week-old female (D) and male (E) mice. Densities of synaptic vesicles (SVs) within 400 nm and 150 nm from the active zone are decreased in Pcdh19HET♀, but not in Pcdh19HEMI♂, mice compared their respective controls. The density and length of PSDs are comparable between all genotypes. n = 93–103 synapses from 10–12 fields from 2 mice per genotype.
(F) Analysis of dendrites and spines of CA3 pyramidal neurons in 4-week-old Pcdh19WT♀ and Pcdh19HET♀ mice, visualized by mating them with the Thy1-GFP-M line. Low and high magnification images are shown. Number of dendritic branches in the SL layer (n = 35–36 dendrites from 5 mice per genotype), spine density (n = 25–28 fields from 5 mice per genotype), and % of mature spines (n = 25–28 fields from 5 mice per genotype) are similar between Pcdh19WT♀ and Pcdh19HET♀ mice.
(G and H) Immunostaining for postsynaptic proteins PSD95 and GluR1 in the CA3 SL layer in 4-week-old Pcdh19WT♀ and Pcdh19HET♀ mice. Density and size of PSD95 (G) and GluR1 (H) puncta are comparable between Pcdh19WT♀ and Pcdh19HET♀ mice. n = 14–16 fields from 4 mice per genotype.
(I and J) Paired-pulse ratio (PPR) of evoked EPSCs at MF synapses from 5-week-old female (I) and male (J) mice (left, sample traces with a 25 ms inter-stimulus interval; right, PPR across a range of inter-stimulus intervals). PPR is significantly increased in Pcdh19HET♀, but not in Pcdh19HEMI♂, mice compared to controls. n = 21 slices for Pcdh19WT♀, 14 for Pcdh19HET♀, 11 for Pcdh19WT♂, and 14 for Pcdh19HEMI♂ from 4 mice each.
(K and L) MF-LTP induced by high-frequency stimulation (2.5 s train at 25 Hz × 25 stimulations) in 5-week-old female (K) and male (L) mice (Left, sample traces before and after the LTP induction; Middle, LTP time course; Right, fEPSP slopes after the LTP induction normalized to baseline). MF-LTP is abolished in Pcdh19HET♀, but not in Pcdh19HEMI♂ mice. n = 12 slices for Pcdh19WT♀, 13 for Pcdh19HET♀, 14 for Pcdh19WT♂, and 10 for Pcdh19HEMI♂ from 4 mice each.
The scale bars represent 10 μm (B, C, F: low magnification, G, and H), 200 nm (D and E), 5 μm (F: high magnification), and 100 μV and 25 ms (I to L). Data are mean ± SEM. *P < 0.05, **P < 0.01 by Student’s t-test (B to H). *P < 0.05 by two-way ANOVA followed by the Sidak test (I and J). *P < 0.05 by Mann-Whitney U test (K and L).