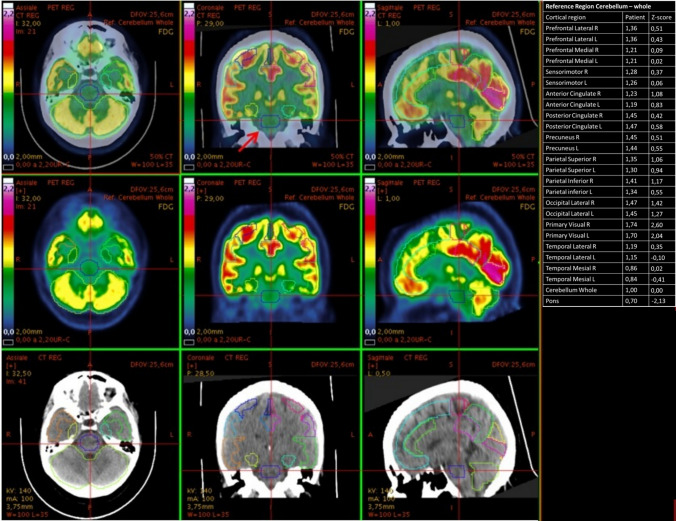
Fig. 2.
18F-FDG PET/CT elaboration using dedicated clinical software (CortexID Suite – GE Healthcare). The cerebellum was chosen as the reference region for intensity normalization. The table on the right reports the quantification of radiopharmaceutical uptake. assessed in terms of deviations from normal values (Z-scores) in specific regions of interest. As shown by the table. the patient (Patient number 1) presented a hypometabolic pontine area. with a Z-score value of − 2.13 compared to healthy age-matched controls. The images panels show. from left to right. the axial. Coronal and sagiptal views; and from top to bottom PET/CT co-registration images. PET-only images and CT-only images. PET images are depicted in Sokoloff scale. The cursor (and the red arrow in the upper middle panel) points on the pontine pathologic area

