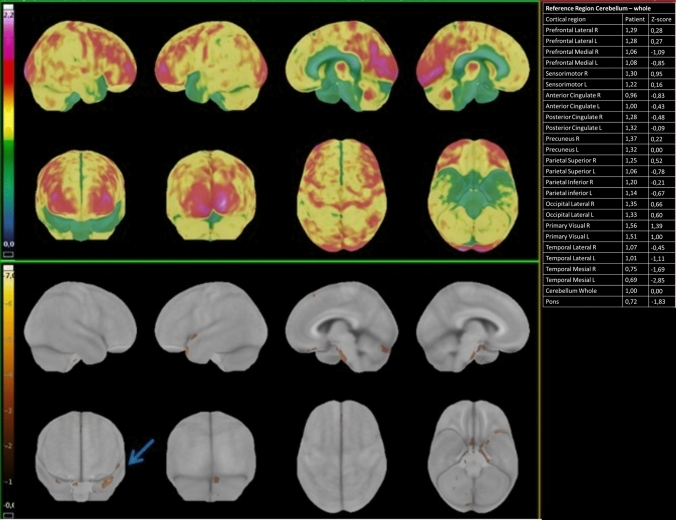
Fig. 3.
18F-FDG PET/CT elaboration using dedicated clinical software (CortexID Suite – GE Healthcare). The cerebellum was chosen as the reference region for intensity normalization. The table on the right reports the quantification of radiopharmaceutical uptake. assessed in terms of deviations from normal values (Z-scores) in specific regions of interest. As shown by the table. The patient (Patient number 3) presented a significant hypometabolism in the left temporal mesial area. with a Z-score value of − 2.85. compared to healthy age-matched controls. The upper panel shows the 3D SSP map of FDG uptake in the specific patient (Sokoloff scale reported on the left). The lower panel is a 3D-SSP z-score image that shows a significant deviation from age-matched controls in the left temporal mesial area (the golden-brown area pointed by the blue arrow)

