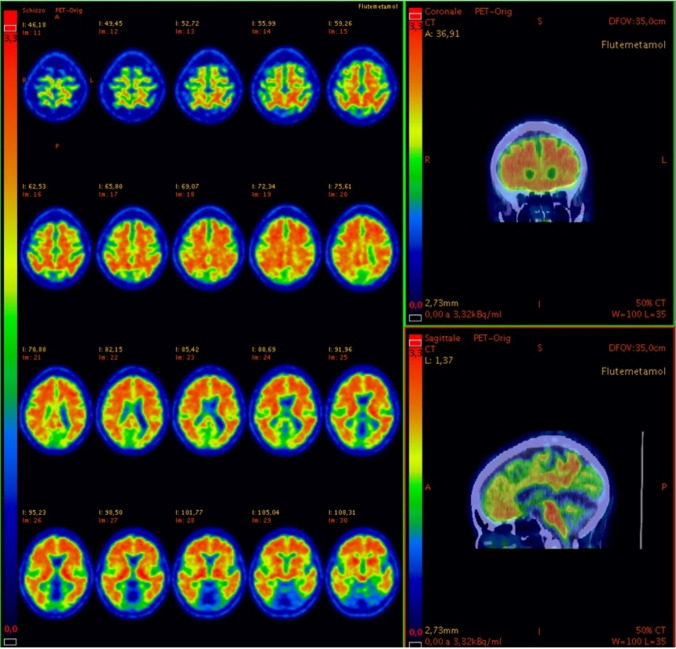
Fig. 4.
18F-amyloid PET/CT in sagittal and coronal views and PET-only scan in axial views. The slices show increased saturation and abnormal uptake in the superior and middle frontal cortex. pathognomonic of Aβ plaque deposition. 18F-amyloid PET/CT and PET-only scan in sagittal views. The slice shows intensity of the uptakes in the posterior cingulate. As shown on the left column in each panel. the images are presented in Rainbow scale and are adjusted according to the guidelines of.18F-flutemetamol PET/TC review (e.g., the color scale to set the pons to approximately 90% maximum intensity)

