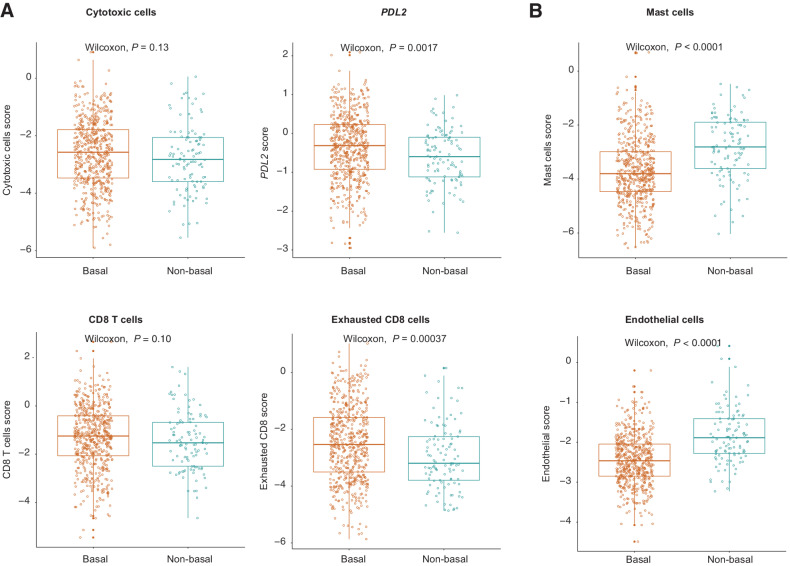
Figure 2.
Expression levels of selected genes and metagene signatures against basal versus non-basal PAM50 status. A, Immune-related signatures. B, Mast cells and endothelial signatures. Boxplots show the median (center bar), the third (top edge), and first quartiles (bottom edge) of selected genes and metagenes. Each point represents one case. All statistical analyses were performed with the two-sided Wilcoxon rank-sum test. The gene contents for each metagene included in the NanoString custom nCounter codeset are displayed in Supplementary Table S1.

