
Figure 9. Downstream pathways from mlSEZt cells.
(A) Colabeling of mlSEZt cells with markers for GABAergic (top) or cholinergic (bottom) neurons. Each row shows mlSEZt labeling (red), the neurotransmitter marker (green), and both channels overlaid. Arrows point to the location of mlSEZt cells in each image. Flies contained R29F12-Gal4 driving UAS-TdT (red) and either VGAT-lexA (top) or ChAT-lexA (bottom) driving Aop-GCaMP6f (green). Additional images are shown in Figure 9—figure supplement 2. (B) Left: trans-Tango labeling of cells postsynaptic to mlSEZt neurons (using the mlSEZt split-Gal4 line). Right: Magnified images showing superior lateral protocerebrum (SLP) staining (top) and cell bodies (bottom). Many cell bodies are colabeled in both red and green, representing lateral connections between mlSEZt cells. (C) Left: Same image as panel B with only the red channel shown for greater visibility. Arrow shows a ventral projection out of the SLP. Right: Magnified image of the SMP showing a projection to the contralateral hemisphere (arrowhead) and ventral projection toward the SEZ (arrow). For clarity, magnified images in panels B and C represent a subset of the z-slices shown in the whole-brain picture, with brightness and contrast adjusted. (D) Putative mlSEZt neurons in the connectome. (E) Interconnectivity between mlSEZt neurons. Connections with at least 5 synapses are shown. Line weights represent connection strength (number of synapses; maximum = 30). (F) Top: Distribution of connection strength from mlSEZt cells to each 3N. The y-axis represents the total number of synapses each 3N receives from all 21 mlSEZt cells. Bottom left: Fraction of top 3Ns projecting to each brain region. Parenthetical ‘C’ refers to the specified region in the hemisphere contralateral to the mlSEZt projection. See Table 1 for abbreviations. Bottom right: Frontal brain slice showing the approximate locations of major regions targeted by 3Ns or 4Ns. Regions in parentheses are not visible in the specific plane shown but are located at that x-y position in an anterior or posterior plane. See Ito et al., 2014 or NeuPrint Explorer for precise region locations. (G) Connectivity between mlSEZt cells and top 3Ns, showing connections with at least 10 synapses (thus not all of the top 3Ns are represented). Line weights represent connection strength (number of synapses; maximum = 18). 3Ns are color-coded based on cell type name prefixes in the connectome, which reflect the cell body location or types defined in previous studies. (H) Left: All top 3Ns (red) shown along with four mlSEZt cells (gray). Right: Top five 3N cell types (red) that receive the strongest mlSEZt input, each shown along with three input mlSEZt cells (gray). (I) Top: Distribution of connection strength from top 3Ns to each 4N receiving ≥20 synapses. The y-axis represents the total number of synapses from top 3Ns onto each 4N. Bottom: Fraction of the top 30 4Ns projecting to each brain region. (J) Left: All top 4Ns (blue) shown along with four mlSEZt cells (gray). Right: Five of the top 4N cell types (blue). Each 4N is shown along with 2–3 input 3Ns (red) and 2–3 mlSEZt inputs to those 3Ns (gray).

Figure 9—figure supplement 1. Morphology of mlSEZt neurons in male brains.
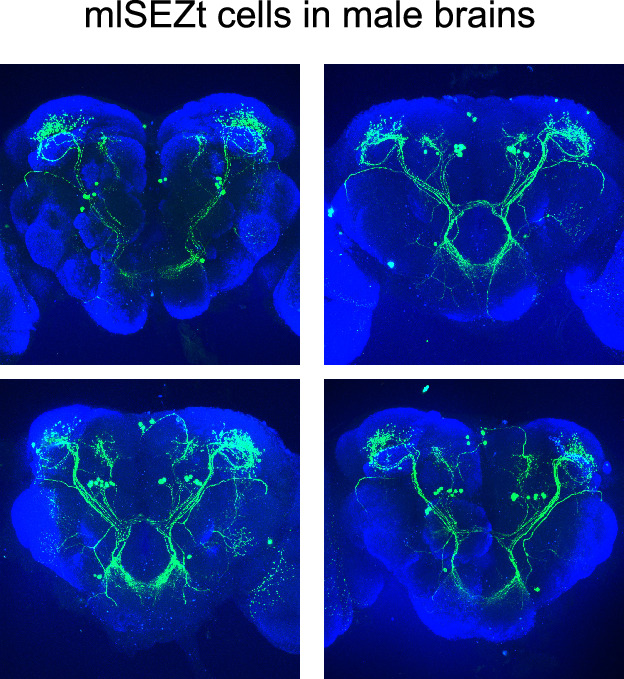
Figure 9—figure supplement 2. Additional images of mlSEZt colabeling with neurotransmitter markers.
