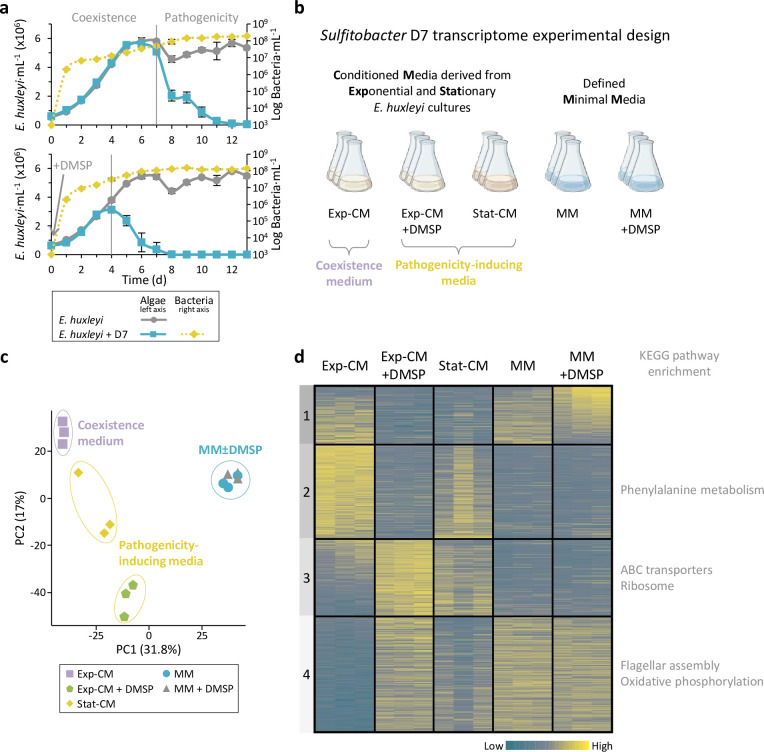
Figure 1. Transcriptional profiling of Sulfitobacter D7 in response to dimethylsulfoniopropionate (DMSP) and additional Emiliania huxleyi infochemicals reveals the signaling role of DMSP.
(a) Time course of E. huxleyi CCMP379 and bacterial abundance (full and dashed lines, left and right axes, respectively) in algal mono-cultures or during co-culturing with Sulfitobacter D7. Top panel: Co-cultures display two phases with distinct bacterial lifestyles: coexistence and pathogenicity. Bottom panel: DMSP was added at day 0 to a final concentration of 100 µM. Results represent average ± SD (n=3). Figure 1a has been adapted from Figure 5 of Barak-Gavish et al., 2018. (b) Design of Sulfitobacter D7 transcriptome experiment aiming to explore gene expression profiles in response to E. huxleyi-derived media and in response to DMSP. Growth media consisted of conditioned media (CM) derived from E. huxleyi at exponential growth or stationary phase (Exp-CM and Stat-CM, respectively), and an additional treatment in which 100 µM of DMSP was added (Exp-CM + DMSP). These media differentially induce the coexistence and pathogenicity lifestyles of Sulfitobacter D7. In order to identify DMSP-responsive genes we inoculated Sulfitobacter D7 in defined minimal media (MM), lacking E. huxleyi-derived exudates, without and with 100 µM DMSP (MM and MM + DMSP, respectively). Sulfitobacter D7 was inoculated into each media and harvested for RNA profiling after 24 hr of growth. Initial conditions of the media and bacterial growth are elaborated in Table 1. (c) Principle component analysis of Sulfitobacter D7 detected genes in all treatments (2588 genes). Triplicates of each treatment are shown. (d) Heatmap of gene expression of all differentially expressed genes in the comparisons Exp-CM + DMSP vs. Exp-CM, Stat-CM vs. Exp-CM, and MM + DMSP vs. MM (1179 genes). Clusters were determined based on k-means analysis. Significant functional enrichment in each cluster, based on Kyoto encyclopedia of genes and genomes (KEGG) pathways, is denoted. Each row represents one gene, and the color intensity corresponds to the standardized expression across all samples (triplicates of each treatment are shown). Expression values are scaled by row. Genes in cluster 1 are ordered based on the mean expression values in the MM + DMSP treatment. Genes in cluster 2–4 are ordered based on the mean expression values in the Exp-CM treatment.


