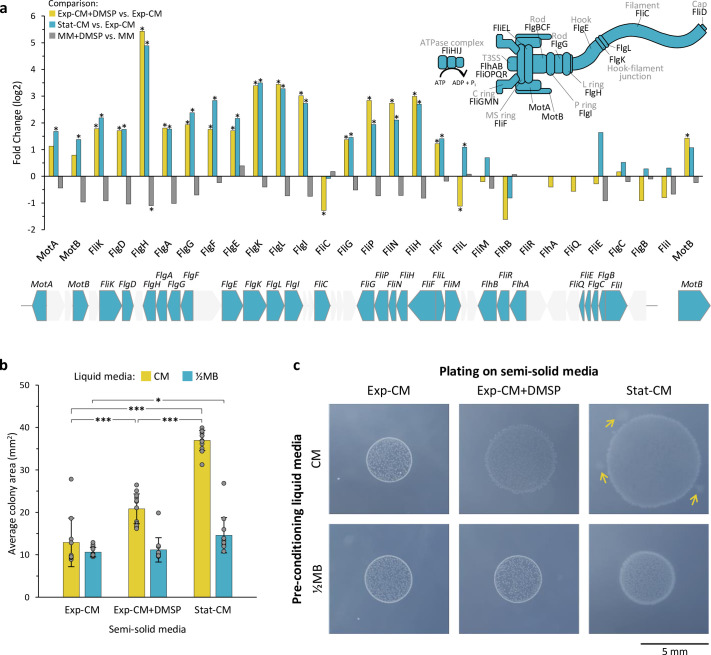
Figure 2. Induction of flagellar genes and increased motility in pathogenicity-inducing media.
(a) Fold change of flagellar gene expression in the comparisons: Exp-CM +DMSP vs. Exp-CM (yellow), Stat-CM vs. Exp-CM (blue), and MM +DMSP vs. MM (gray). Genes marked with * are significantly differentially expressed. The flagellar genes are localized in a gene cluster on the Sulfitobacter D7 chromosome, as shown below the graph. Genes in gray are not related to the flagellum. The function of each gene is indicated in the flagellum assembly scheme on the top-right. Expression values are presented in Figure 2—source data 1. (b) Bacterial motility inferred by the colony area of Sulfitobacter D7 plated on semi-solid agar media. Bacteria were pre-conditioned in liquid CM (Exp-CM, Exp-CM + DMSP, and Stat-CM) for 24 hr and plated on the corresponding semi-solid CM plates (yellow bars). For control, bacteria were pre-conditioned on liquid marine broth (½MB) and plated on semi-solid CM plates (blue bars). Colony area was determined after 6 days of growth. Results represent average ± SD (n=10–12 colonies per treatment). Statistical differences were tested using two-way analysis of variance, followed by Tukey’s post-hoc test. * p-value <0.05, *** p-value <0.0001. (c) Representative bacterial colonies from each treatment showing the difference in colony area and morphology. The arrows depict bacterial motility extensions from the core colony. The extensions were not included in the colony area measurements. DMSP, dimethylsulfoniopropionate; CM, conditioned media; MM, minimal media; Exp-CM, exponential CM; Stat-CM, stationary CM.

