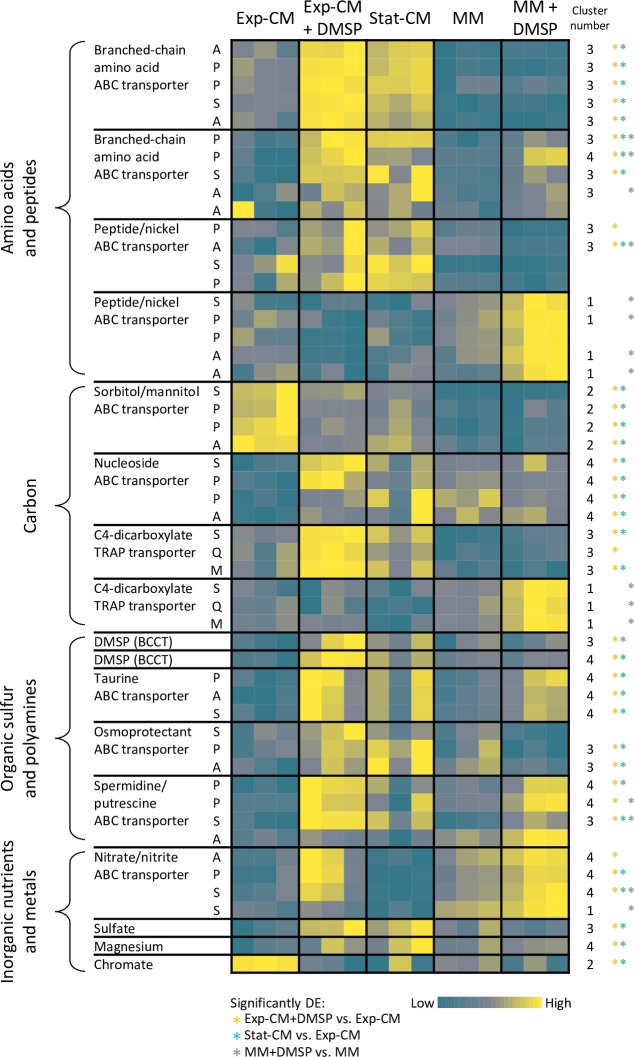
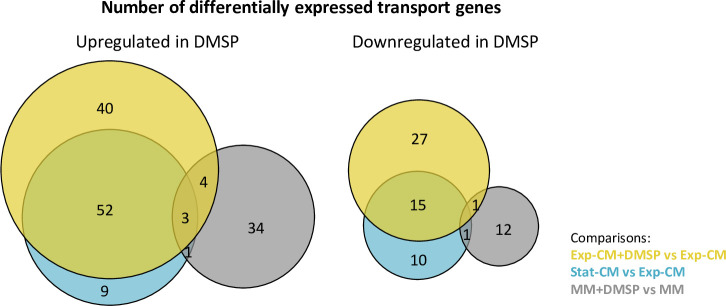
Figure 3. Remodeling of Sulfitobacter D7 transport systems in response to dimethylsulfoniopropionate (DMSP) and Emiliania huxleyi-derived metabolites.
Heatmap of gene expression of representative transport genes for various metabolite classes. Each row represents one gene, and the blocks represent a complete transport system in which at least two genes were differentially expressed (DE) in the comparisons indicated on the bottom. The column ‘cluster number’ corresponds to the heatmap cluster in Figure 1d in which the gene is found. Colored * denotes in which comparison of the gene was significantly DE. Color intensity corresponds to the standardized expression across all samples (triplicates of each treatment are shown). Expression values are scaled by row. Expression and fold-change values are presented in Figure 3—source data 1. ABC, ATP-binding cassette; TRAP, tripartite ATP-independent periplasmic; BCCT, betaine/carnitine/choline transporter. The letters correspond to the transport system components: A, ATP-binding; S, substrate-binding; P, permease; Q, dctQ subunit; M, dctM subunit.


