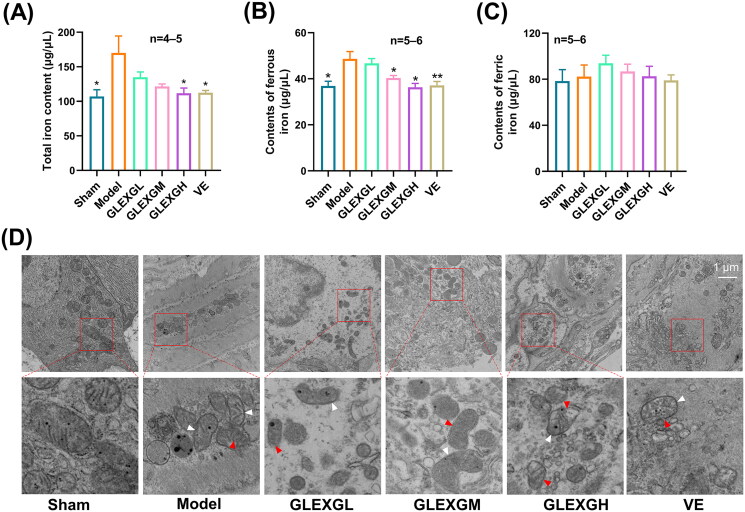
Figure 4.
GLEXG improved iron metabolism of testicular tissue in OAS rat model induced by GTW. (A–C) Levels of total, ferric and ferrous iron in each group. (D) Representative images of transmission electron microscopy of sperm mitochondria morphology in each group. White arrowheads indicate shrunken mitochondria; red arrowheads indicate cytoplasmic and organelle swelling, as well as plasma membrane rupture. Data are shown as the means ± SEM. *p < 0.05, **p < 0.01 vs. the model group, respectively.

