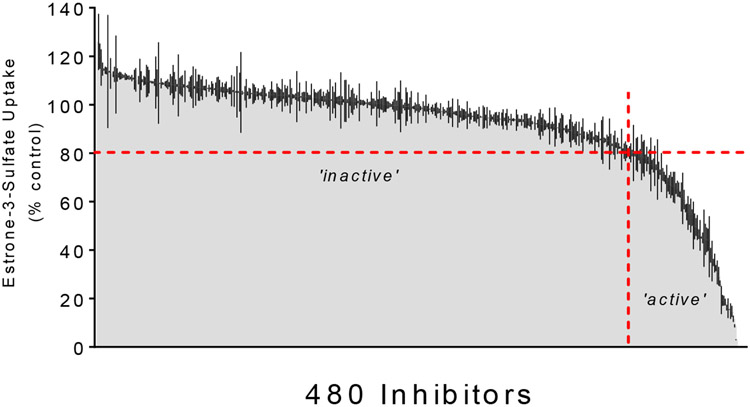
Figure 2.
The inhibitory effect of 480 test compounds from the Spectrum Collection on the OATP1B1-mediated transport of ~12 μM [3H]E3S. The 60 sec accumulation of substrate was measured in the presence of a 20 μM concentration of each test agent. The height of the shaded grey region indicates the average (±SD; black lines) accumulation (expressed relative to uptake measured in the absence of inhibitor, i.e., ‘control’) determined in two-three separate experiments, each measured in triplicate and corrected for uptake measured in wild-type CHO cells. The histograms are arranged from no inhibition (left side) to complete inhibition (right side). The horizontal red dashed line indicates 20% inhibition, while the vertical red dashed line divides the ‘active’ inhibitors (≤20 % of control uptake; to the right) from the ‘inactive’ inhibitors (>20 % control, to the left).

