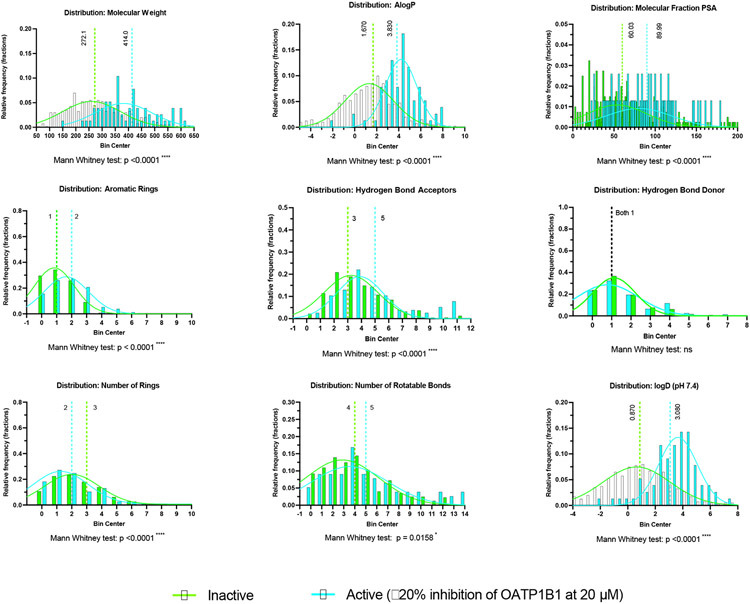
Figure 3.
Comparison of the distribution of molecular properties for 476 unique compounds in the OATP1B1 dataset split into active (77 compounds) and inactive (399 compounds) groups. Median values are highlighted along with statistical analyses. The gaussians are meant to visually highlight each group and are not meant to imply a normal distribution.

