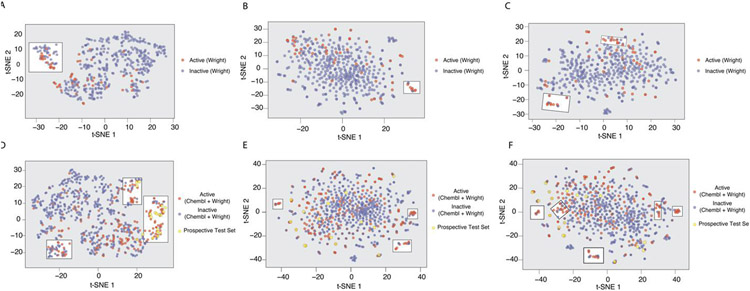
Figure 5.
t-SNE plots of compounds tested against OATP1B1 classified by activity (Active ≥ 20% inhibition at 20μM) using various descriptors. The descriptors used were either simple chemical descriptors alone (A,D), fingerprints (ECFP6) (B,E) or simple chemical descriptors plus ECFP6 (C,F). The compounds in the training set (tested in this study alone) (A-C) show the most separation using chemical descriptors alone as highlighted by a white box (A). In addition to those compounds used in the training set, D-F also have the compounds from the external test as well as those chosen for a prospective test set. The most visible separation was also seen with the simple descriptors alone as highlighted by the white box. The highlighted separation has been manually selected and is meant as a visual aid and not a separation metric.

