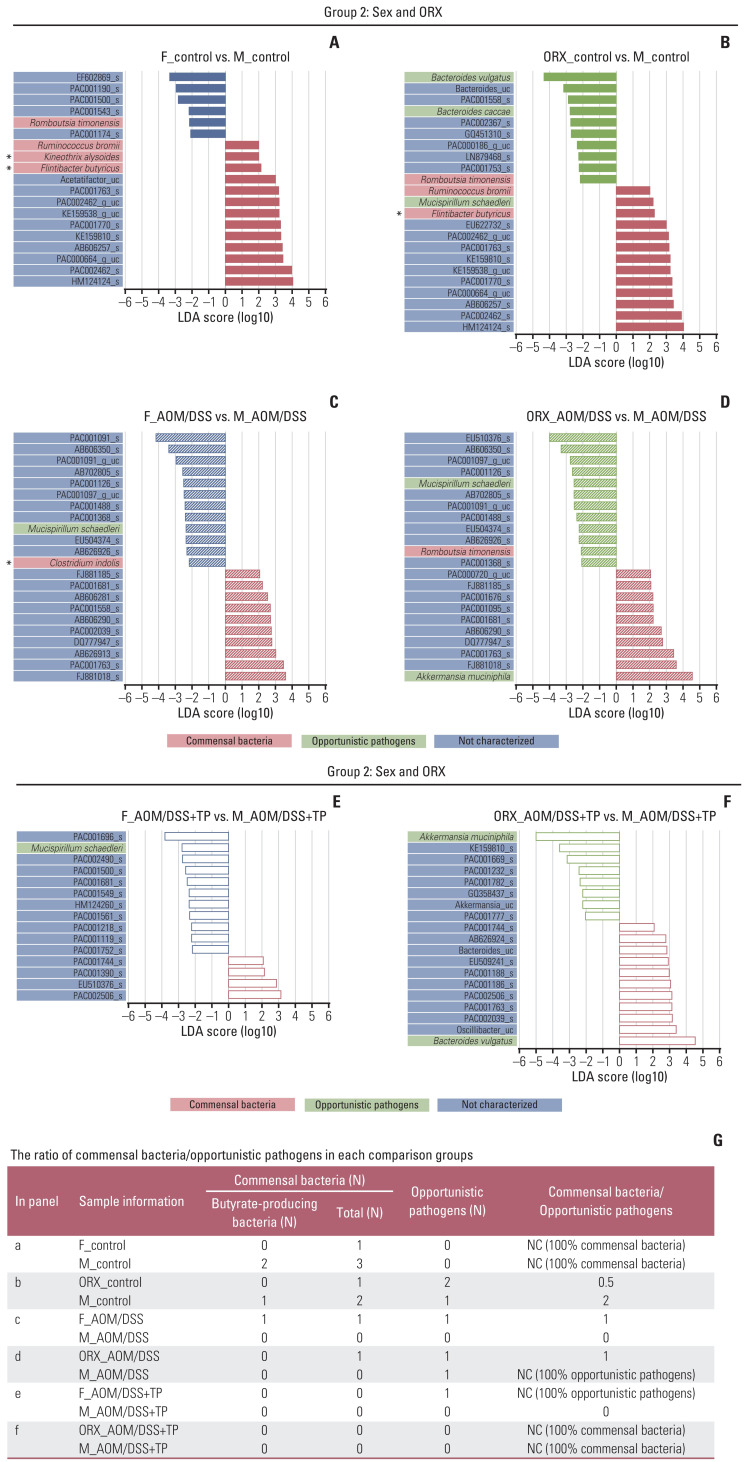
Fig. 5.
Changes in the abundance ratio of the gut microbiome by sex and ORX: LEfSe analysis. (A–F) Bar plots of the LEfSe results, which were generated based on the criteria mentioned in the legend of Fig. 4. The color bars show the LDA scores of species that enriched in indicated conditions: (A) filled red bar (female control), (A, B) filled blue bar (male control), (B) filled green bar (ORX control), (C) hatched red bar (AOM/DSS-treated female), (C, D) hatched blue bar (AOM/DSS-treated male), (D) hatched green bar (AOM/DSS-treated ORX mice). (E) blanked red bar (AOM/DSS+TP-treated female), (E, F) blanked blue bar (AOM/DSS+TP-treated male), (F) blanked green bar (AOM/DSS+TP-treated ORX mice). The color on the species name indicates the characteristics of each species: yellow for commensal bacteria, orange for opportunistic pathogens, and green for not characterized bacteria. Arstericks indicate the butyrate-producing bacteria. The p- and q-values were determined using the non-parametric factorial Kruskal-Wallis H test. (G) The ratio of commensal bacteria to opportunistic pathogens based on the LEfSe results in each comparison group. AOM, azoxymethane; DSS, dextran sulfate sodium salt; F, female; LDA, linear discriminant analysis; LEfSe, linear discriminant analysis effect size; M, male; NC, not calculated; ORX, orchiectomized; TP, testosterone propionate.

