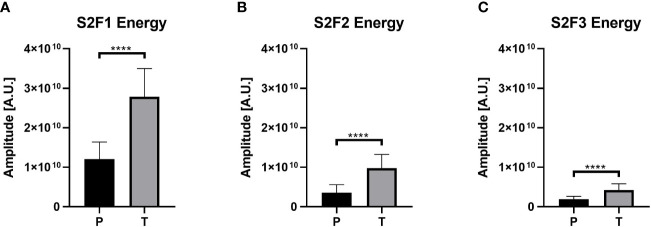
Figure 4.
Energy values for the channel 2 in the three different subbands. The three panels can corroborate the difference between the P and T groups, where the T group presents higher values than P. (A) Values for the S2F1 combination. (B) Shows the values of Energy for S2F2 and (C) the Energy values for S2F3. **** represents p-value lower than 0.0001.

