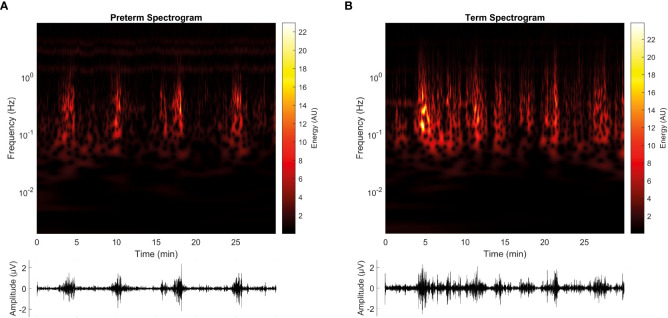
Figure 5.
Representative spectrograms of EHG signals for the term (T) and preterm (P) groups. (A) shows the spectrogram retrieved from the participant no. 10, from the preterm group (P, recorded at 30 weeks of gestation and triggered labor at 32 weeks of gestation), while (B) shows the spectrogram retrieved from participant no. 9, from the term group (T, recorded at 30 weeks of gestation and triggered labor on 39 weeks of gestation). Below each spectrogram, the EHG signal can be visualized. Both spectrograms are derived from the S2 signal.

