
Figure 1.
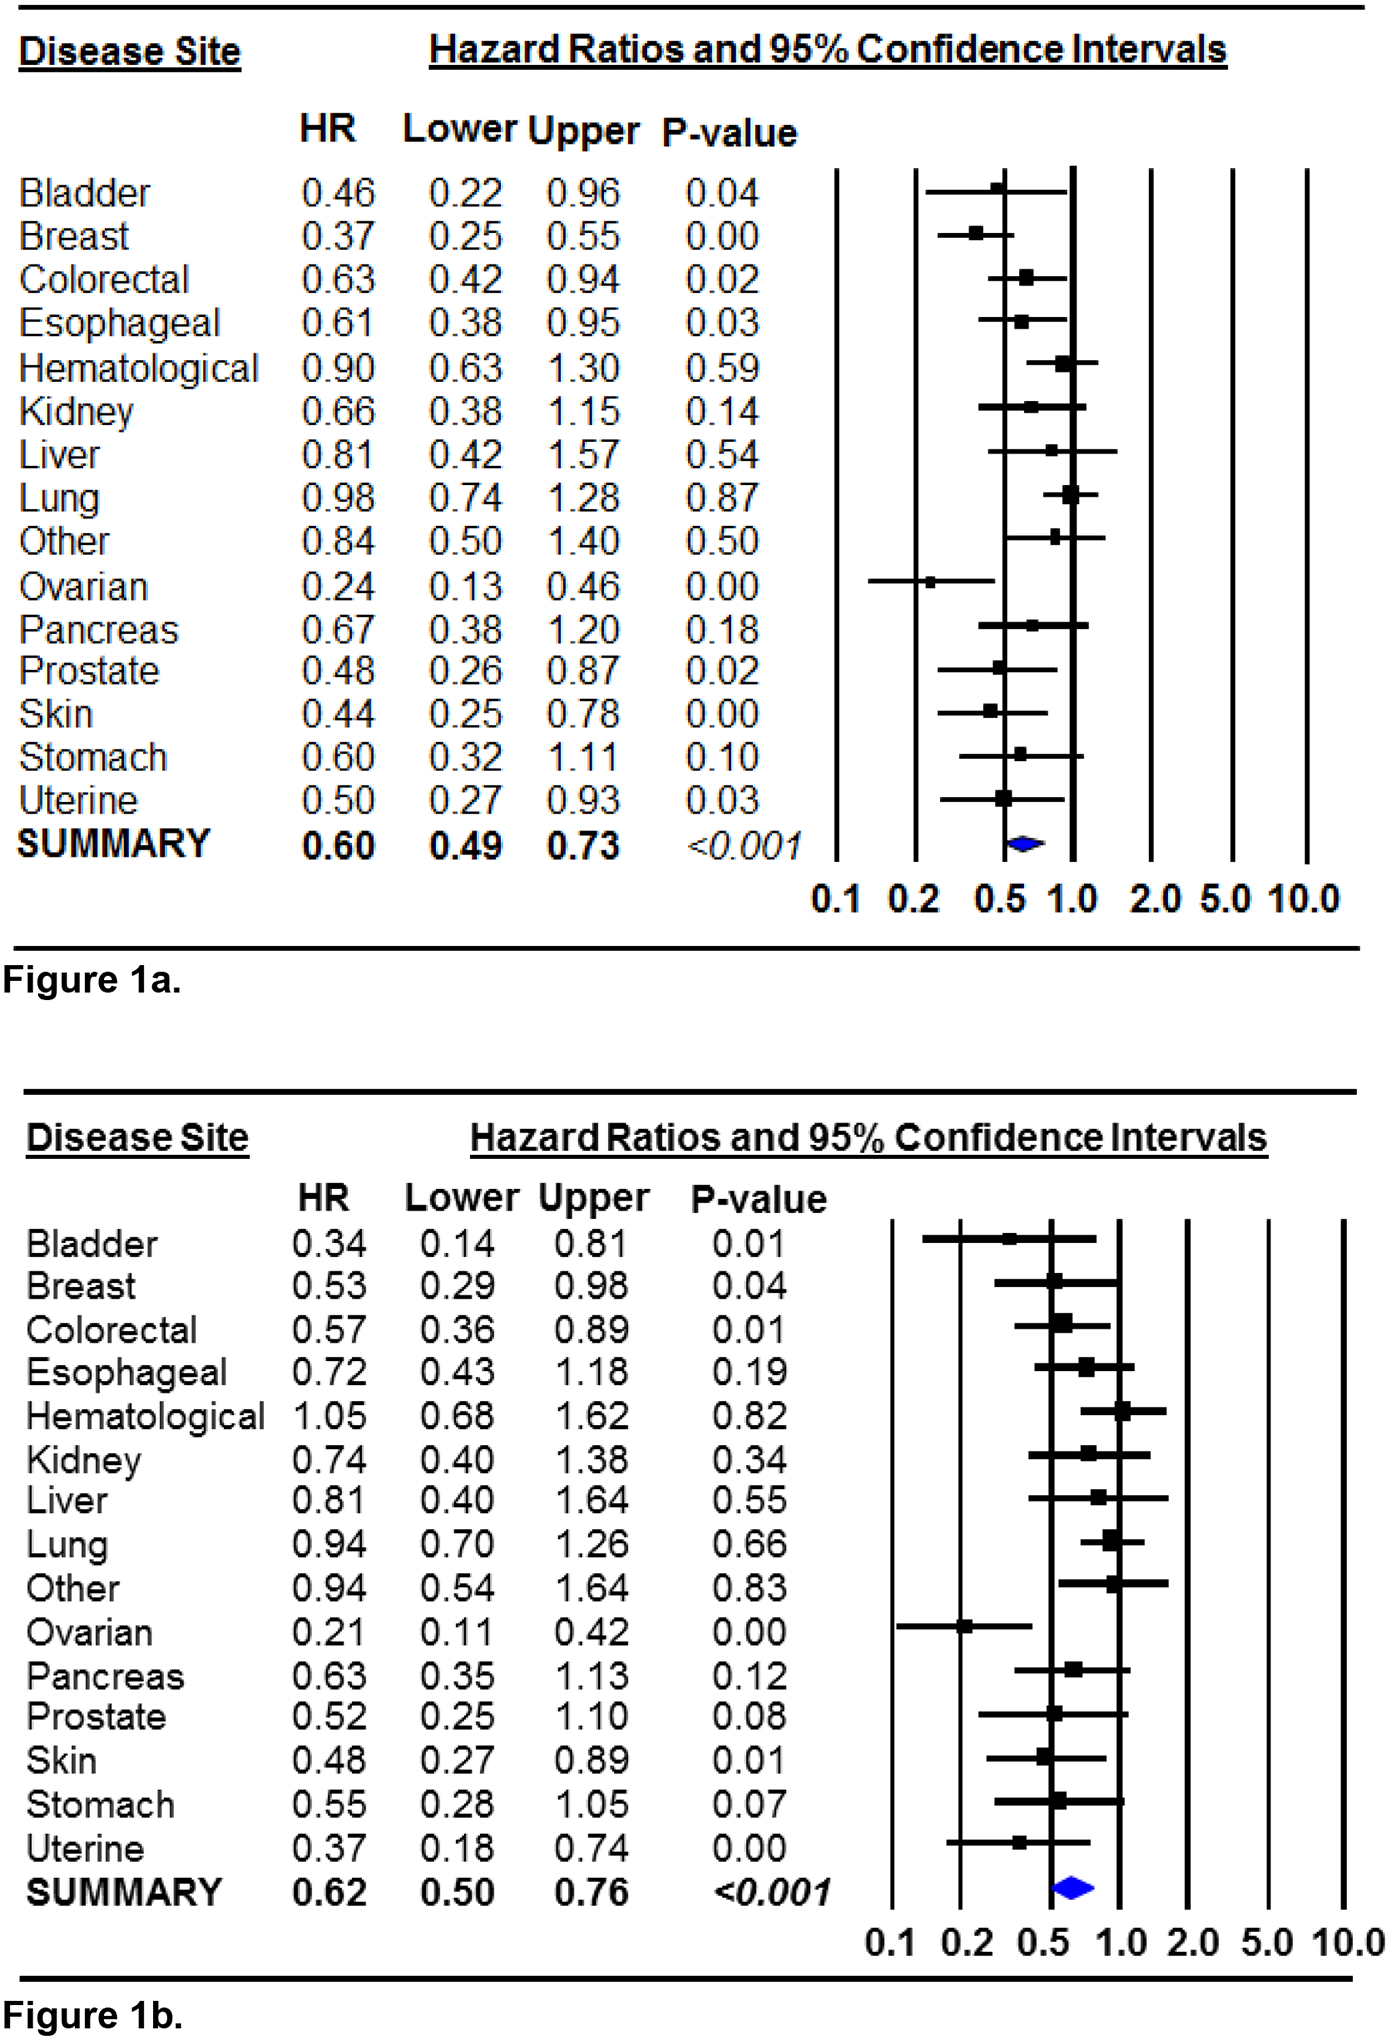
Forest plots of the hazard ratios and 95% confidence intervals representing the associations of habitual recreational physical activity, in comparison to habitual inactivity, with all-cause mortality (Figure 1a) and cancer-specific mortality (Figure 1b) by disease site. Multivariable models were adjusted for age of diagnosis, sex, tumor stage and smoking. The random-effects summary estimates are presented in both figures because significant heterogeneity was noted. Each square represents the disease site-specific HRs and the corresponding horizontal lines represent the width of the 95% CIs. The weighted, summary HR and its 95% CI is represented by the diamond in each figure.