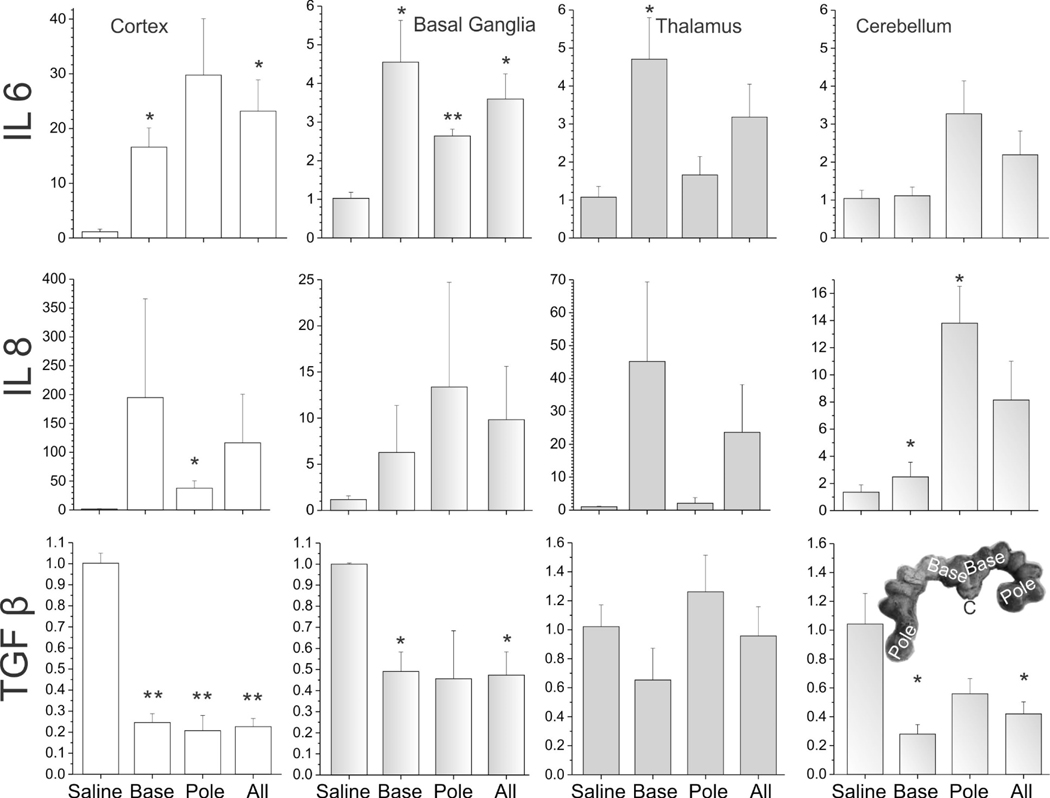
Figure 7.
The expression of cytokines in different brain regions of E29 fetus. IL-6, IL-8 and TGF-β. The unit of Y-axis is fold change, with n=3–4 in each group. The 4 columns represent the saline group, the base group, the pole group, and LPS group (all=base + pole), respectively. *p<0.05; **p<0.01, compared with the saline group.

