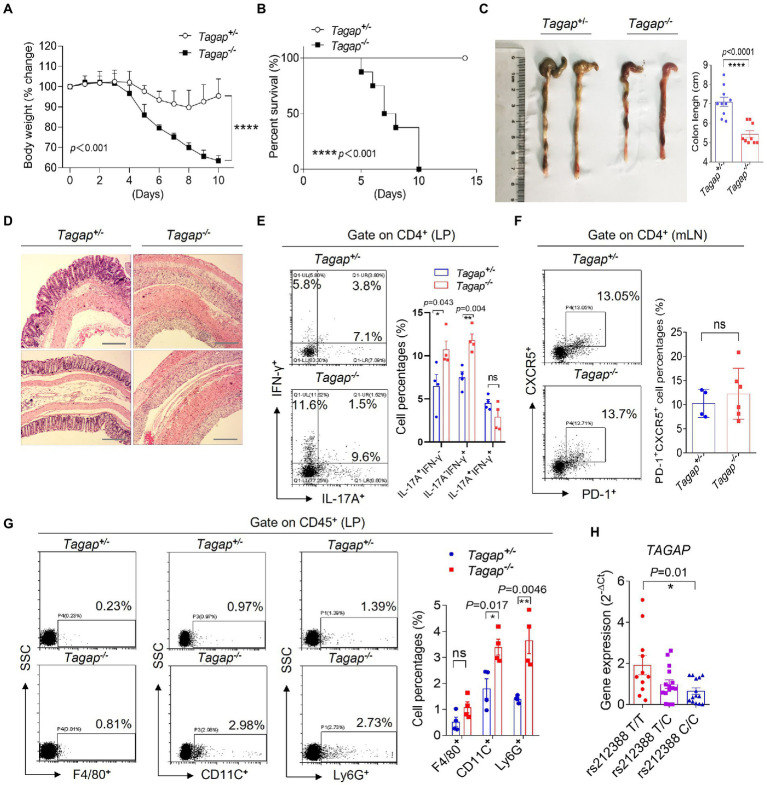
Figure 1.
TAGAP-deficient mice were susceptible to DSS-induced colitis. (A) Littermate control mice or TAGAP-deficient mice were treated with 3% of DSS in the drinking water for 5 days, and then changed to normal water. Mice weight curve was shown, n = 7. (B) Littermate control mice or TAGAP-deficient mice were treated with 3% of DSS in the drinking water for 5 days, and then changed to normal water. Mice survival curve was shown, n = 9. (C) Representative colon picture of DSS-treated control mice and TAGAP-deficient mice was shown (left). Colon length of control mice and TAGAP-deficient mice after DSS treatment was shown (right), n = 9. (D) Hematoxylin staining of transversal sections of colon sample from DSS-treated control mice and TAGAP-deficient mice at day 7 was shown. Scale bar: 150 μm. (E–G) Cells were isolated from lamina propria (E,G) or mesenteric lymph nodes (F) from littermate control mice or TAGAP-deficient mice after DSS treatment for 5 days, followed by flow cytometry analysis of indicated cells, n = 4. (H) TAGAP mRNA level was examined in the PBMCs of different individuals who carried the indicated TAGAP genotypes, n = 11, 15, and 14. The weight loss (A) and survival data (B) were from separate experiments. *p < 0.05, **p < 0.01, ***p < 0.001, ****p < 0.0001 based on two-way ANOVA (A), Two-sided unpaired T test (C,E–H) and Log-rank (Mantel-Cox) Test for panel (B). All error bars represent SEM of technical replicates. Data are representative of three independent experiments.

