Figure 3.
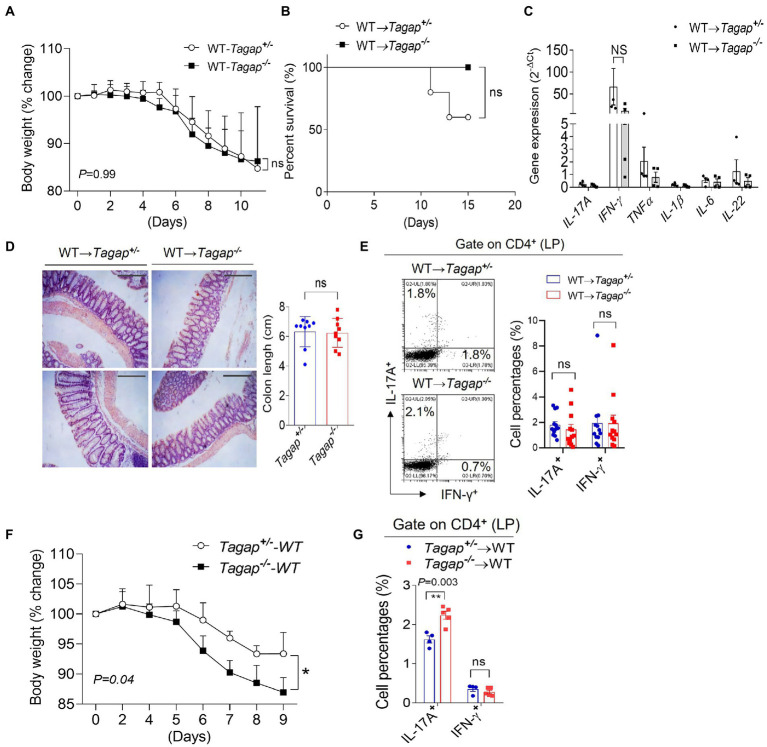
FMT rescue the severe phenotype of TAGAP-deficient mice in colitis. (A,B) Littermate control mice or TAGAP-deficient mice were transplanted feces from wild-type mice as described in the Method, followed by 3% of DSS treatment for 5 days, and then changed to normal water. Mice weight curve was shown in panel (A), n = 9; mice survival curve was shown in panel (B), n = 5. Mice weight curve (A) and survival curve (B) were done in separate experiments. (C) Mice were treated as in A, and colonic samples were isolated from littermate control mice or TAGAP-deficient mice after DSS treatment for 7 days, followed by real-time PCR analysis for the indicated genes. (D) Mice were treated as in A, and hematoxylin staining of transversal sections of colon sample after DSS treatment for 10 days was shown (left panel), Scale bar: 150 μm. Colon length was shown (right panel), n = 9. (E) Mice were treated as in A, and cells were isolated from lamina propria of control mice or TAGAP-deficient mice after DSS treatment for 5 days, followed by flow cytometry analysis of CD4+IL-17A+ and CD4+IFN-γ+ cells, n = 12. (F) Wild-type mice were transplanted feces from littermate control mice or TAGAP-deficient mice as described in the Method, followed by 3% of DSS treatment for 5 days, and mice weight change was shown, n = 4. (G) Mice were treated as in F, and cells were isolated from lamina propria of wild-type recipient mice after DSS treatment for 5 days, followed by flow cytometry analysis of CD4+IL-17A+ and CD4+IFN-γ+ cells, n = 5. *p < 0.05, **p < 0.01, ***p < 0.001, ****p < 0.0001 based on 2-way ANOVA (A,F), Log-rank (Mantel-Cox) Test for (B) and unpaired T test (C–E,G). All error bars represent SEM of technical replicates. Data are representative of three independent experiments.

