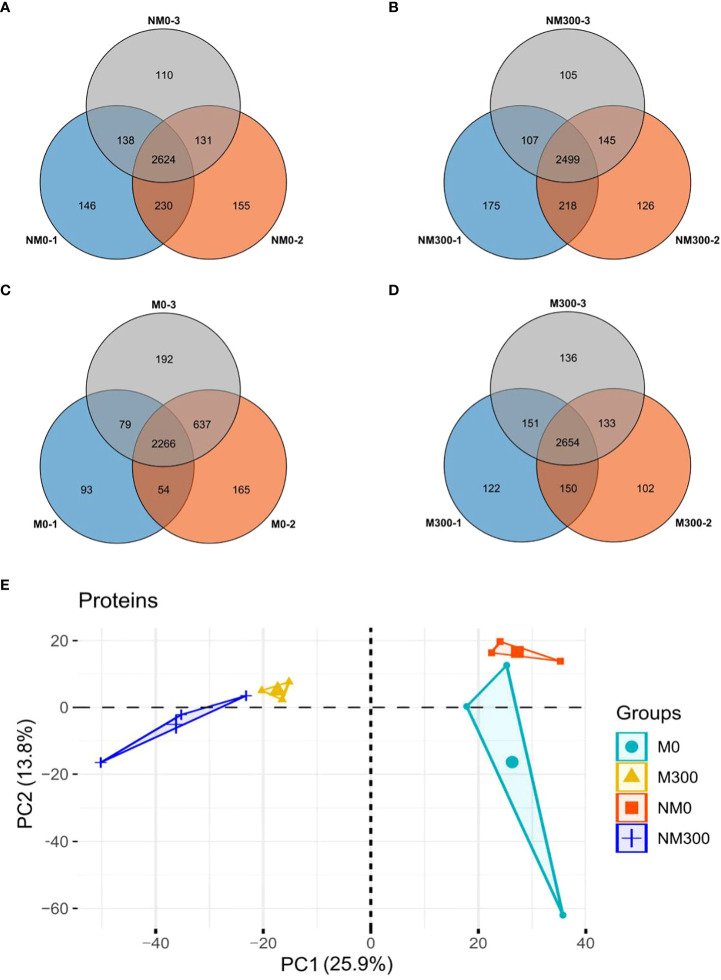
Figure 2.
Statistics of the number of proteins identified in each treatment group. (A) Venn diagram of the number of proteins identified in the NM0 group; (B) Venn diagram of the number of proteins identified in the NM300 group; (C) Venn diagram of the number of proteins identified in the M0 group; (D) Venn diagram of the number of proteins identified in the M300 group; (E) PCA of proteomic data in each treatment group.

