
Fig. 2.
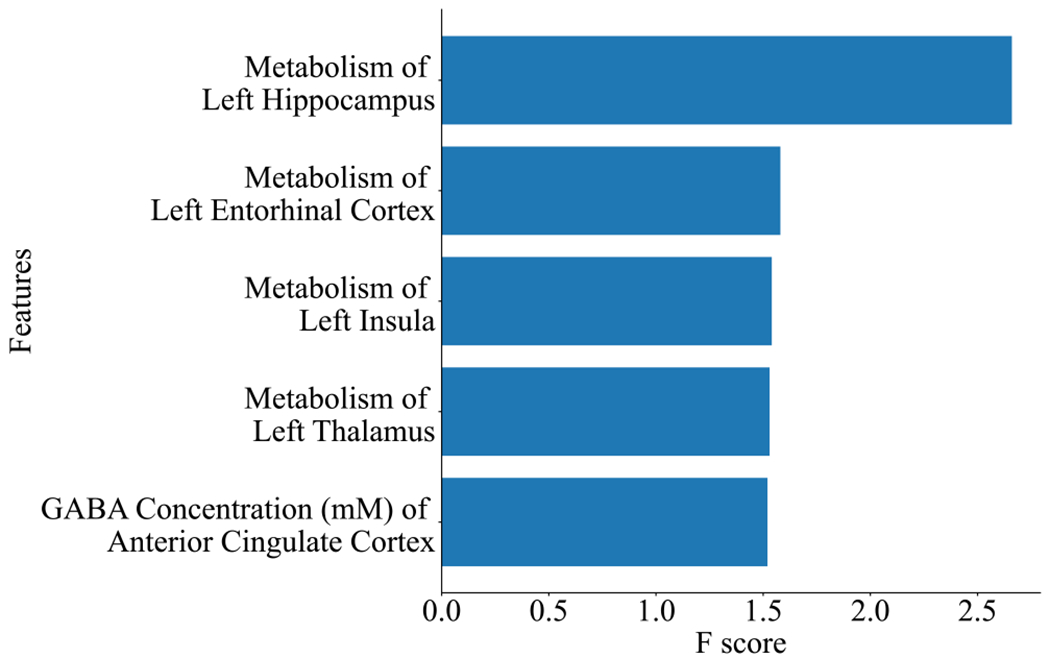
The most predictive imaging features from the XGBoost model. The features are as follows: metabolism estimated by the metabolic rate of glucose (MRGlu, mg/(min*100 mL)) of left hippocampus, left entorhinal cortex, left insula, left thalamus and GABA (γ-aminobutyric acid) concentration of anterior cingulate cortex. F score: relative contribution of the feature to the prediction model.