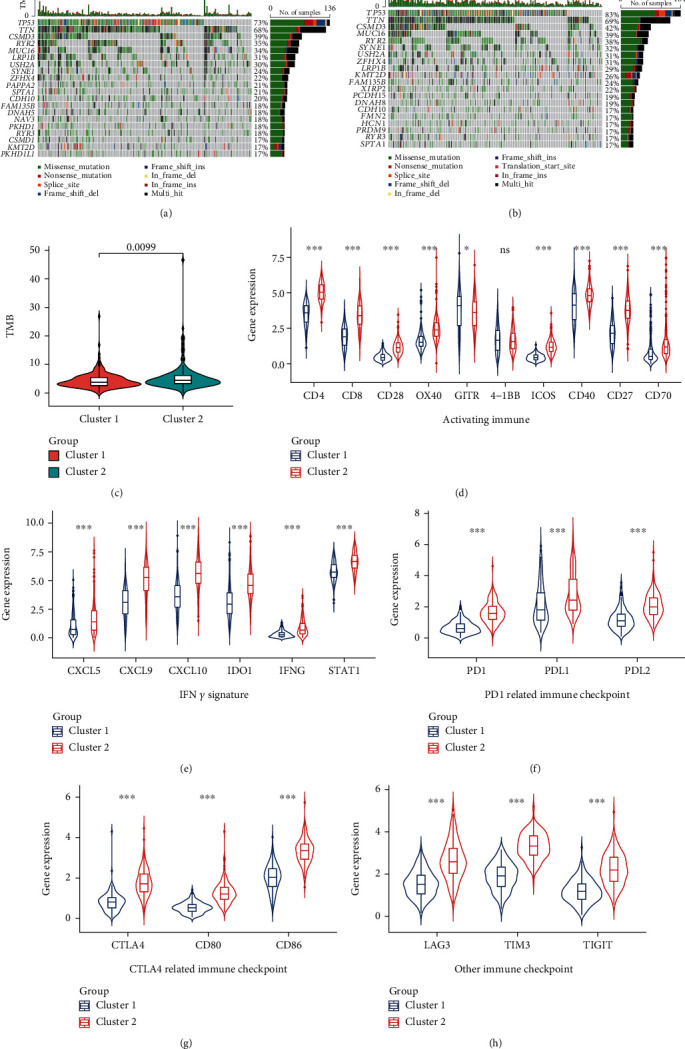
Figure 10.

Comparison of the gene mutation landscape and the expression of immunomodulatory targets between two clusters. Mutational landscapes of cluster 1 (a) and cluster 2 (b). (c) Comparison of the tumor mutation burden (TMB) level between the two clusters. The expression levels of key genes in activating immune (d) and IFN γ signature (e) pathways were compared between the two clusters. The expression levels of PD1-related (PD1, PDL1, and PDL2) (f) and CTLA4-related (CTLA4, CD80, and CD86) (g) and other (LAG3, TIM3, and TIGIT) (h) immune checkpoints were compared between the two clusters. ns: no significance. ∗p < 0.05 and ∗∗∗p < 0.001.
