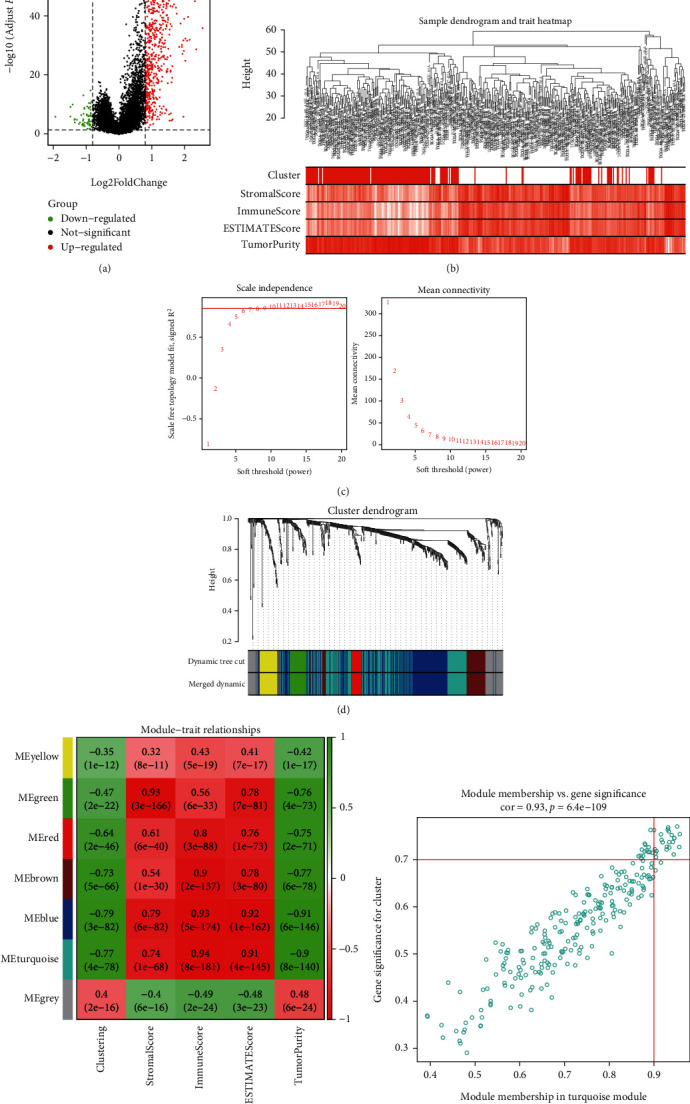
Figure 11.

Identification of module genes related to clustering and immunity in weighted gene coexpression network analysis (WGCNA). (a) The volcano plot of DEGs (the filtering criteria were adjusted p value < 0.05 and |log2FC| > 0.8). (b) Sample dendrogram and trait heatmap based on two clusters of DEGs and immune characteristics in the TCGA cohort. (c) The scale-free fitting index of soft threshold power (β), and 9 was the most suitable power value. (d) Gene dendrogram and module colors. (e) The correlation heatmap of module eigengenes, clustering, and ESTIMATE results. (f) Scatter plot of module eigengenes in the turquoise module (the filtering criteria were |MM| > 0.9 and |GS| > 0.7).
