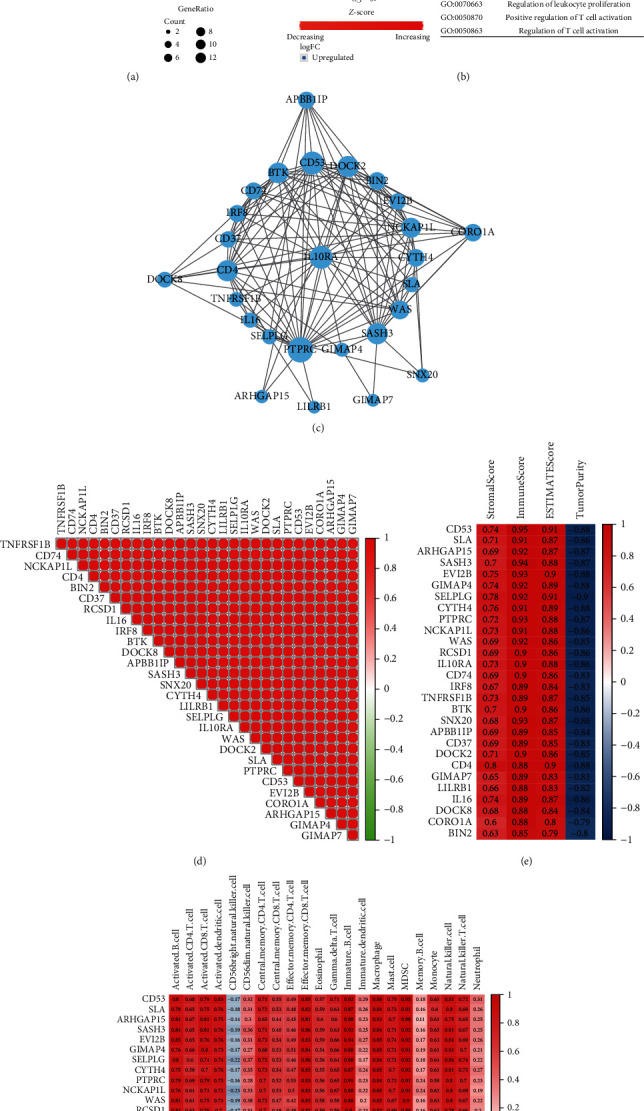
Figure 12.

Analysis of 28 hub genes. (a, b) GO enrichment analysis of 28 hub genes. (c) The protein-protein interaction (PPI) network of 28 hub genes. (d) The correlation heatmap of 28 hub genes. (e) The correlation heatmap between hub genes and results of ESTIMATE. (f) The correlation heatmap between hub genes and expression of immune cells (ssGSEA).
