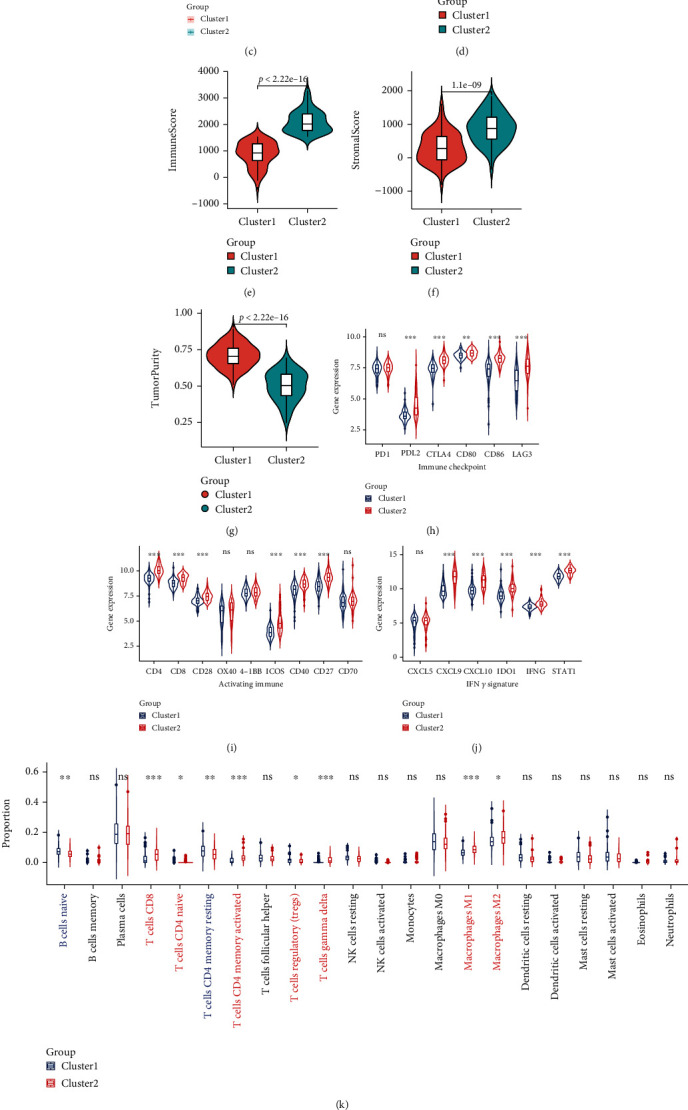
Figure 13.

GEO validation of PTGIS and HRASLS in evaluating prognosis and tumor immunity of LUSC. (a) Based on the expression of PTGIS and HRASLS, the GSE4753 cohort was divided into two clusters. (b) Association between PTGIS and HRASLS expression in the GSE4753 cohort. (c) The Kaplan-Meier survival curve of two clusters. Comparison of ESTIMATEScore (d), ImmuneScore (e), StromalScore (f), TumorPurity (g), the expression of immunomodulatory markers (h–j), proportion of 22 immune cells (k), and expression of 28 immune cells (l) between two clusters. ns: no significance. ∗p < 0.05, ∗∗p < 0.01, and ∗∗∗p < 0.00.
