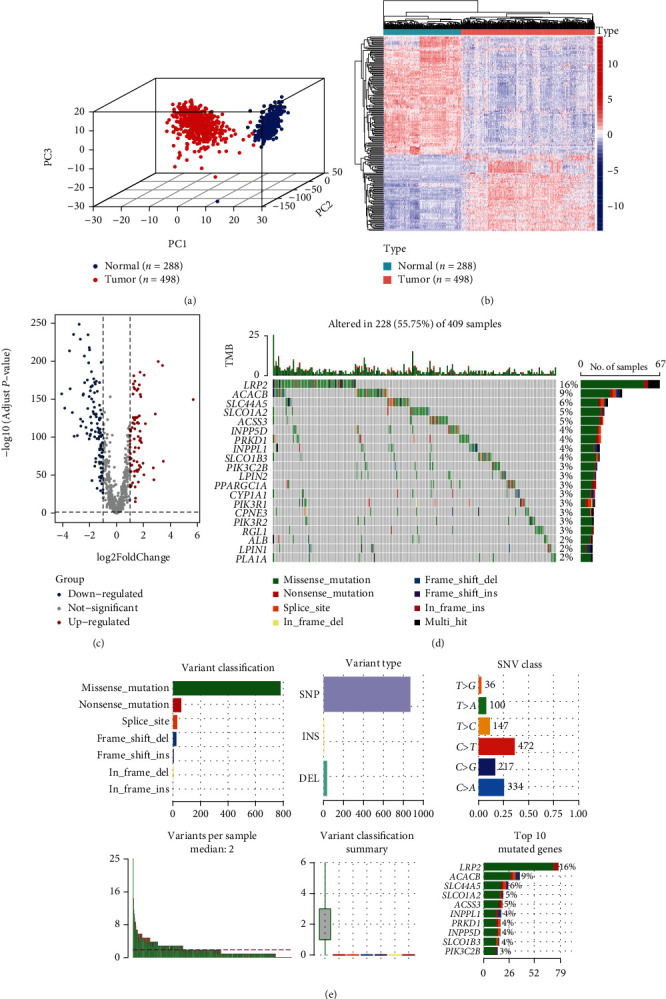
Figure 2.

Identification and mutation landscapes of lipid metabolism-related DEGs. (a) The 3D plot of principal component analysis (PCA) between the TCGA dataset (tumor = 498) and the GTEx dataset (normal = 288). (b, c) The heatmap and volcano plot of 191 lipid metabolism-related DEGs (the filtering criteria were adjusted p value < 0.05 and |log2FC| > 1). (d, e) The mutation frequency and classification of 191 lipid metabolism-related DEGs in LUSC.
